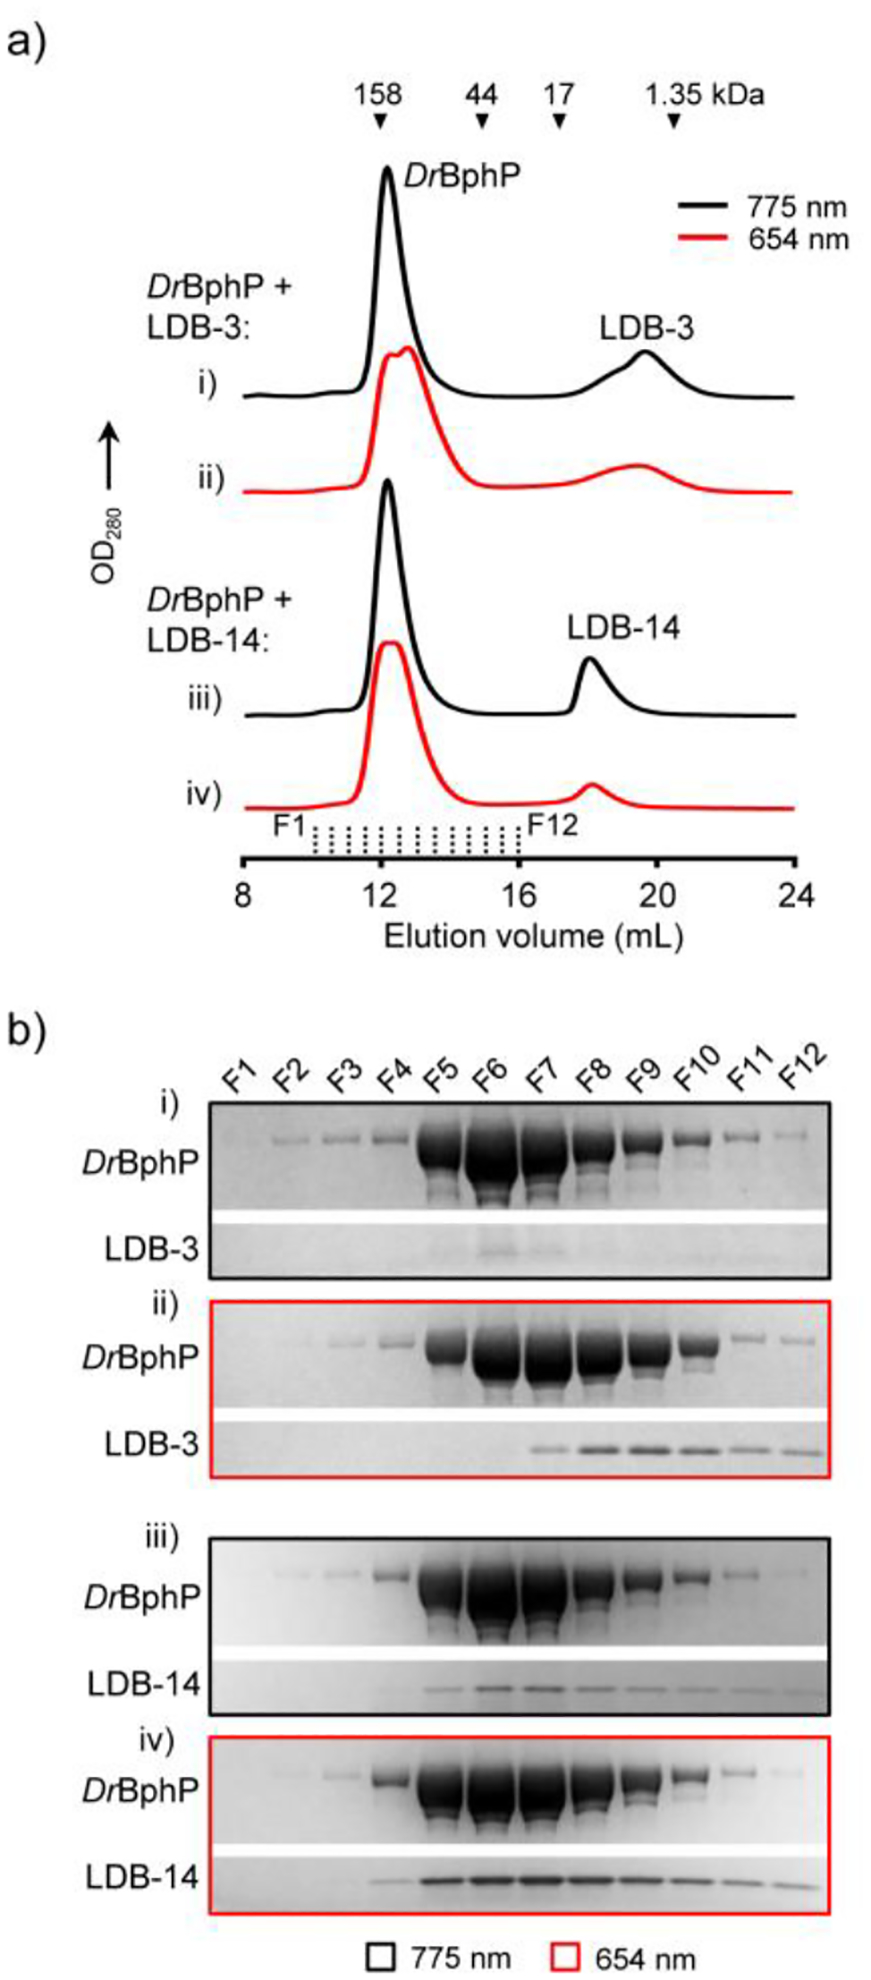
Figure 4.

Detection of light-induced DrBphP-nanobody complexes. a) Analytical SEC. ~6 μM (final concentration) DrBphP after the 654-nm (0.2 mW/cm2) or 775-nm (0.8 mW/cm2) illumination for 5 min were incubated with ~5 μM (final concentration) LDB-3 or LDB-14 in the dark. 500 μL mixtures were loaded onto a Superdex 200 Increase 10/300 GL column pre-equilibrated with 1× PBS buffer and eluted at 0.75 mL/min at 4°C. Elution volumes of protein standards are marked by triangles. b) SDS-PAGE analysis of the fractions (500 μL each) collected in the SEC (marked by dash lines in a)) and concentrated by trichloroacetic acid precipitation. Only gel regions showing DrBphP and nanobody bands are shown.
