
Figure 5.
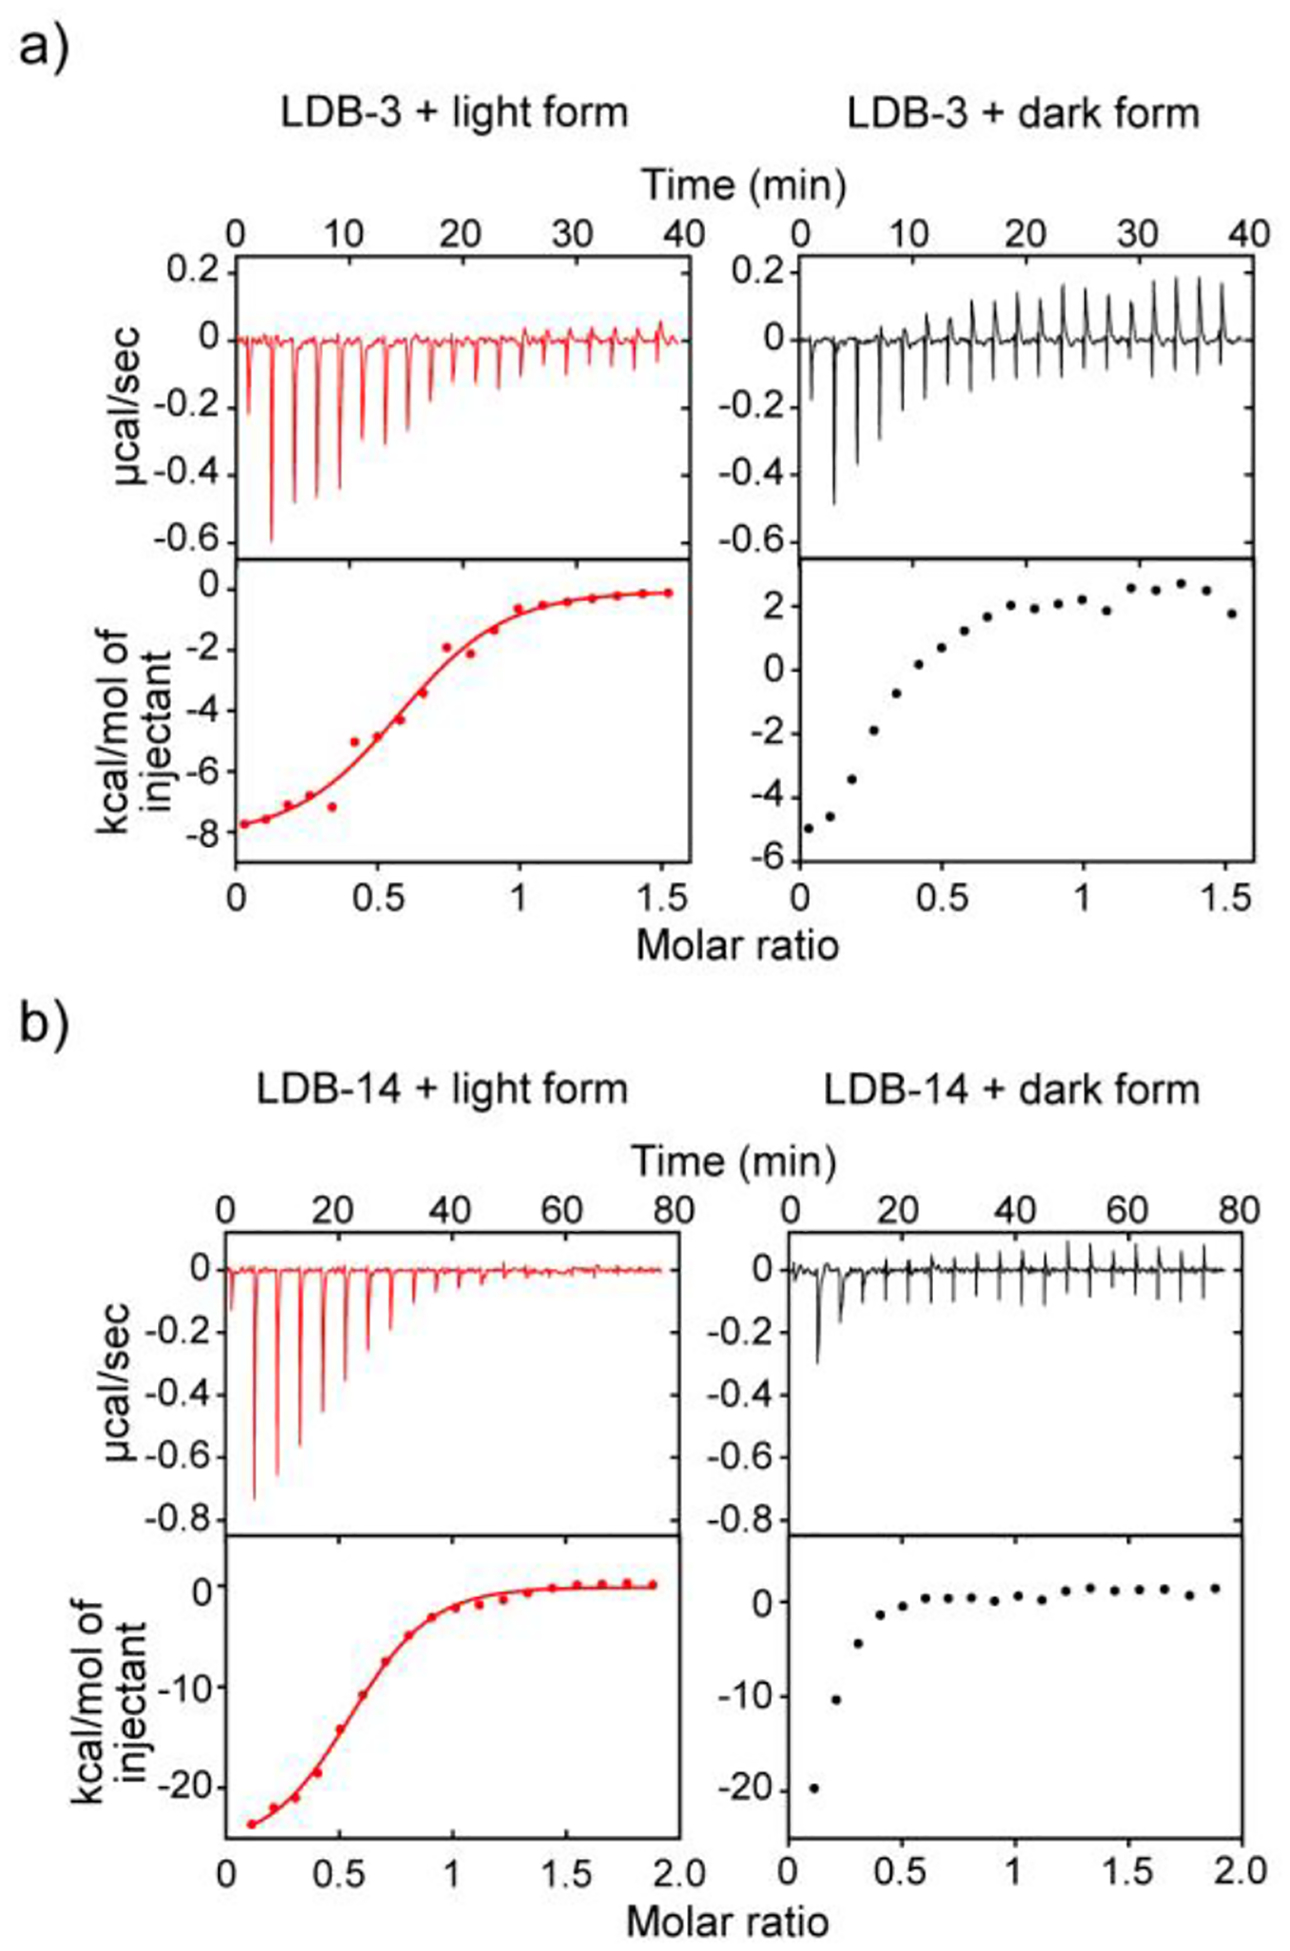
ITC thermographs of the nanobody binding. a) 80 μM LDB-3 and b) 50 μM LDB-14 were titrated into 10 μM and 5 μM DrBphP, respectively. The light and dark forms were converted by the 654-nm (0.2 mW/cm2) and 775-nm (0.2 mW/cm2) lights, respectively. The raw data (top) and the integration of heats (bottom) for each titration are shown.