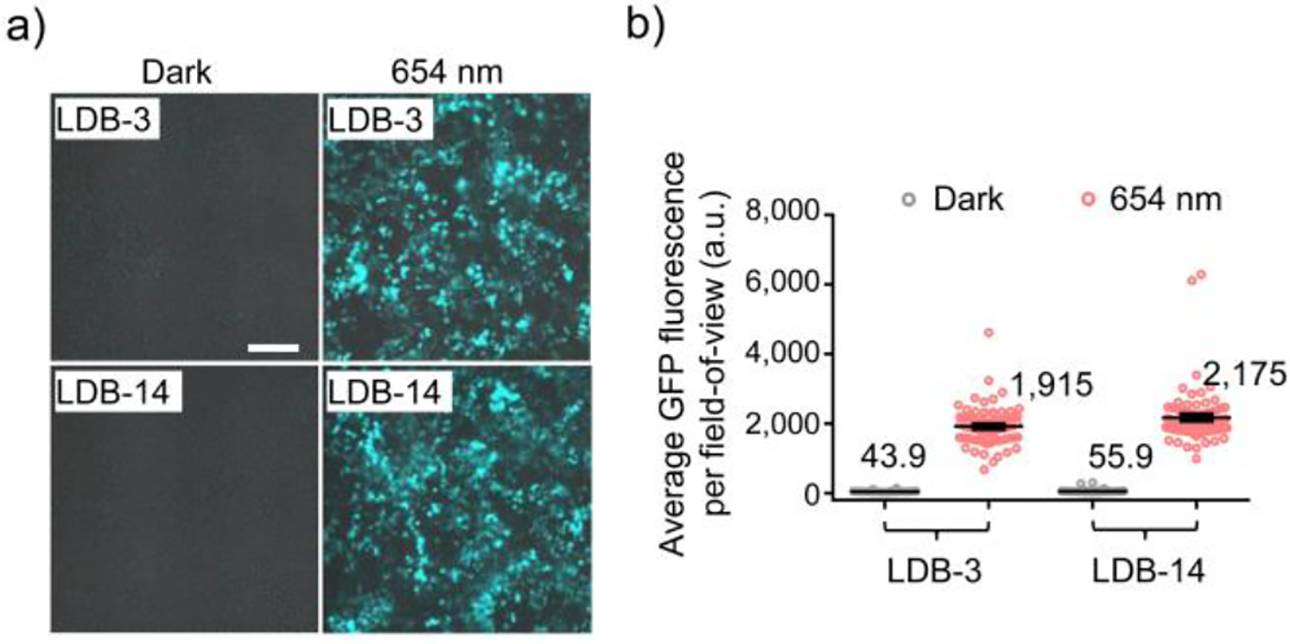
Figure 6.

Red light-induced GFP expression. a) Representative overlaid brightfield and fluorescence images of GFP-expressing HEK293T cells. Cells were transduced with a lentiviral GFP expression vector and then co-transfected with the LID plasmids after 654-nm (0.2 mW/cm2) illumination or in the dark for 48 hours. No biliverdin was supplemented in the medium. Scale bar, 200 μm. b) Comparison of GFP fluorescence intensities in fields-of-view (FOVs). Data represent mean values of 78 FOVs; error bars, standard error of the mean (SEM).
