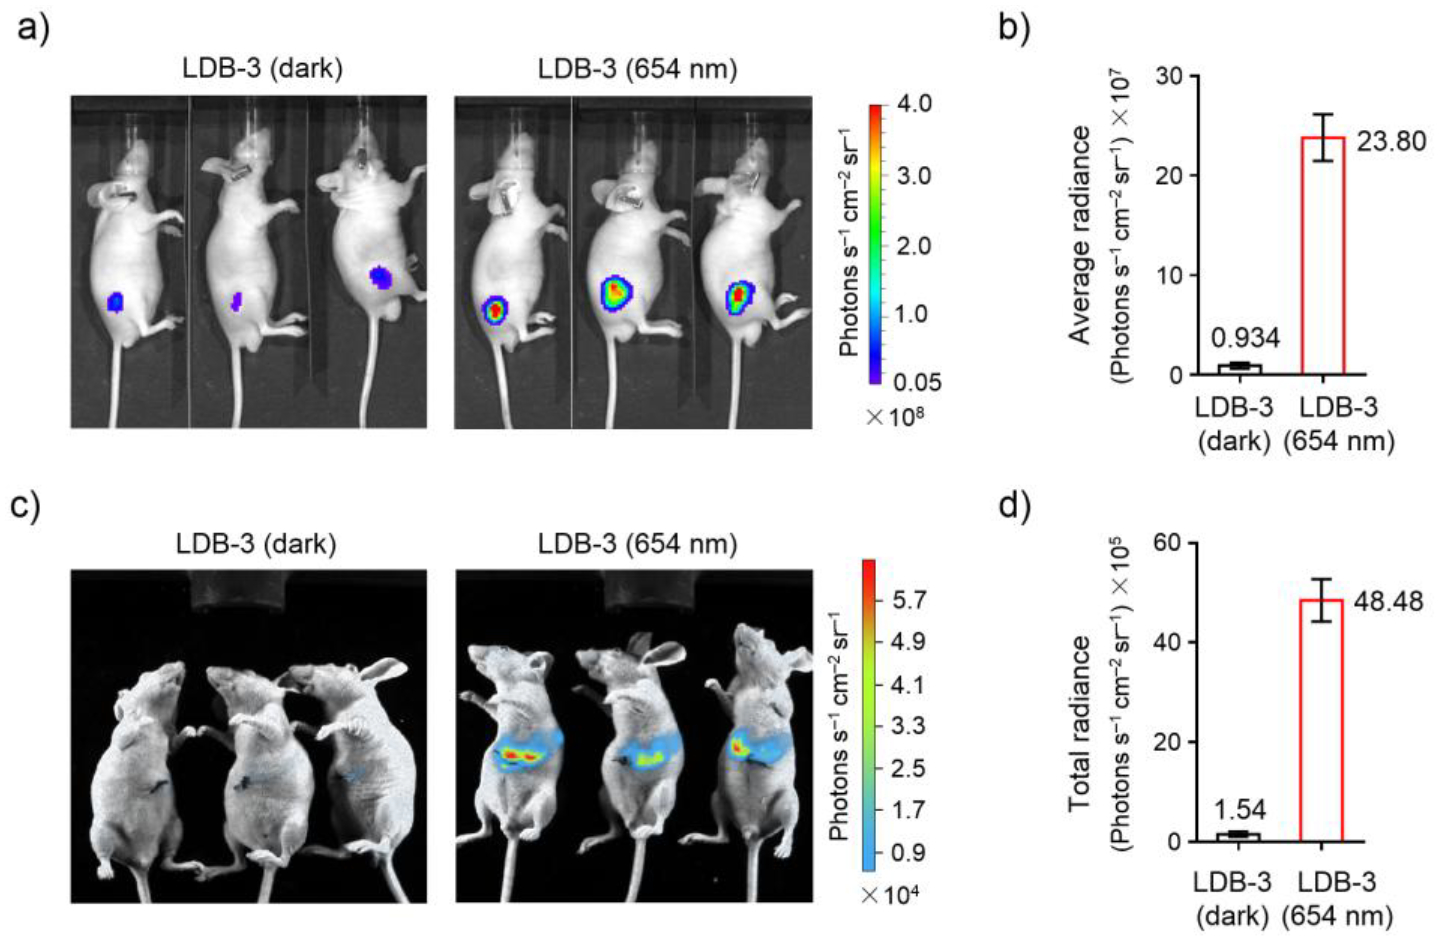
Figure 8.

In vivo transcription activation in mice. a) Bioluminescence imaging of nude mice after subcutaneous injection with HEK293T cells co-transfected with the LID and the luciferase reporter plasmids and then kept under 645-nm illumination (0.03 mW/cm2) or in the dark for 24 hours. b) Comparison of average bioluminescence intensities of imaged mice in a). Data represent the mean ± SEM (n = 3 mice per group). c) Bioluminescence imaging of nude mice after transplantation of the co-transfected HEK293T cells into the liver and then treated similarly as in a). d) Comparison of total bioluminescence intensities of imaged mice in c). Data represent the mean ± SEM (n = 3 mice per group). Different detection sensitivities in a) and c) were due to different in vivo imaging systems used.
