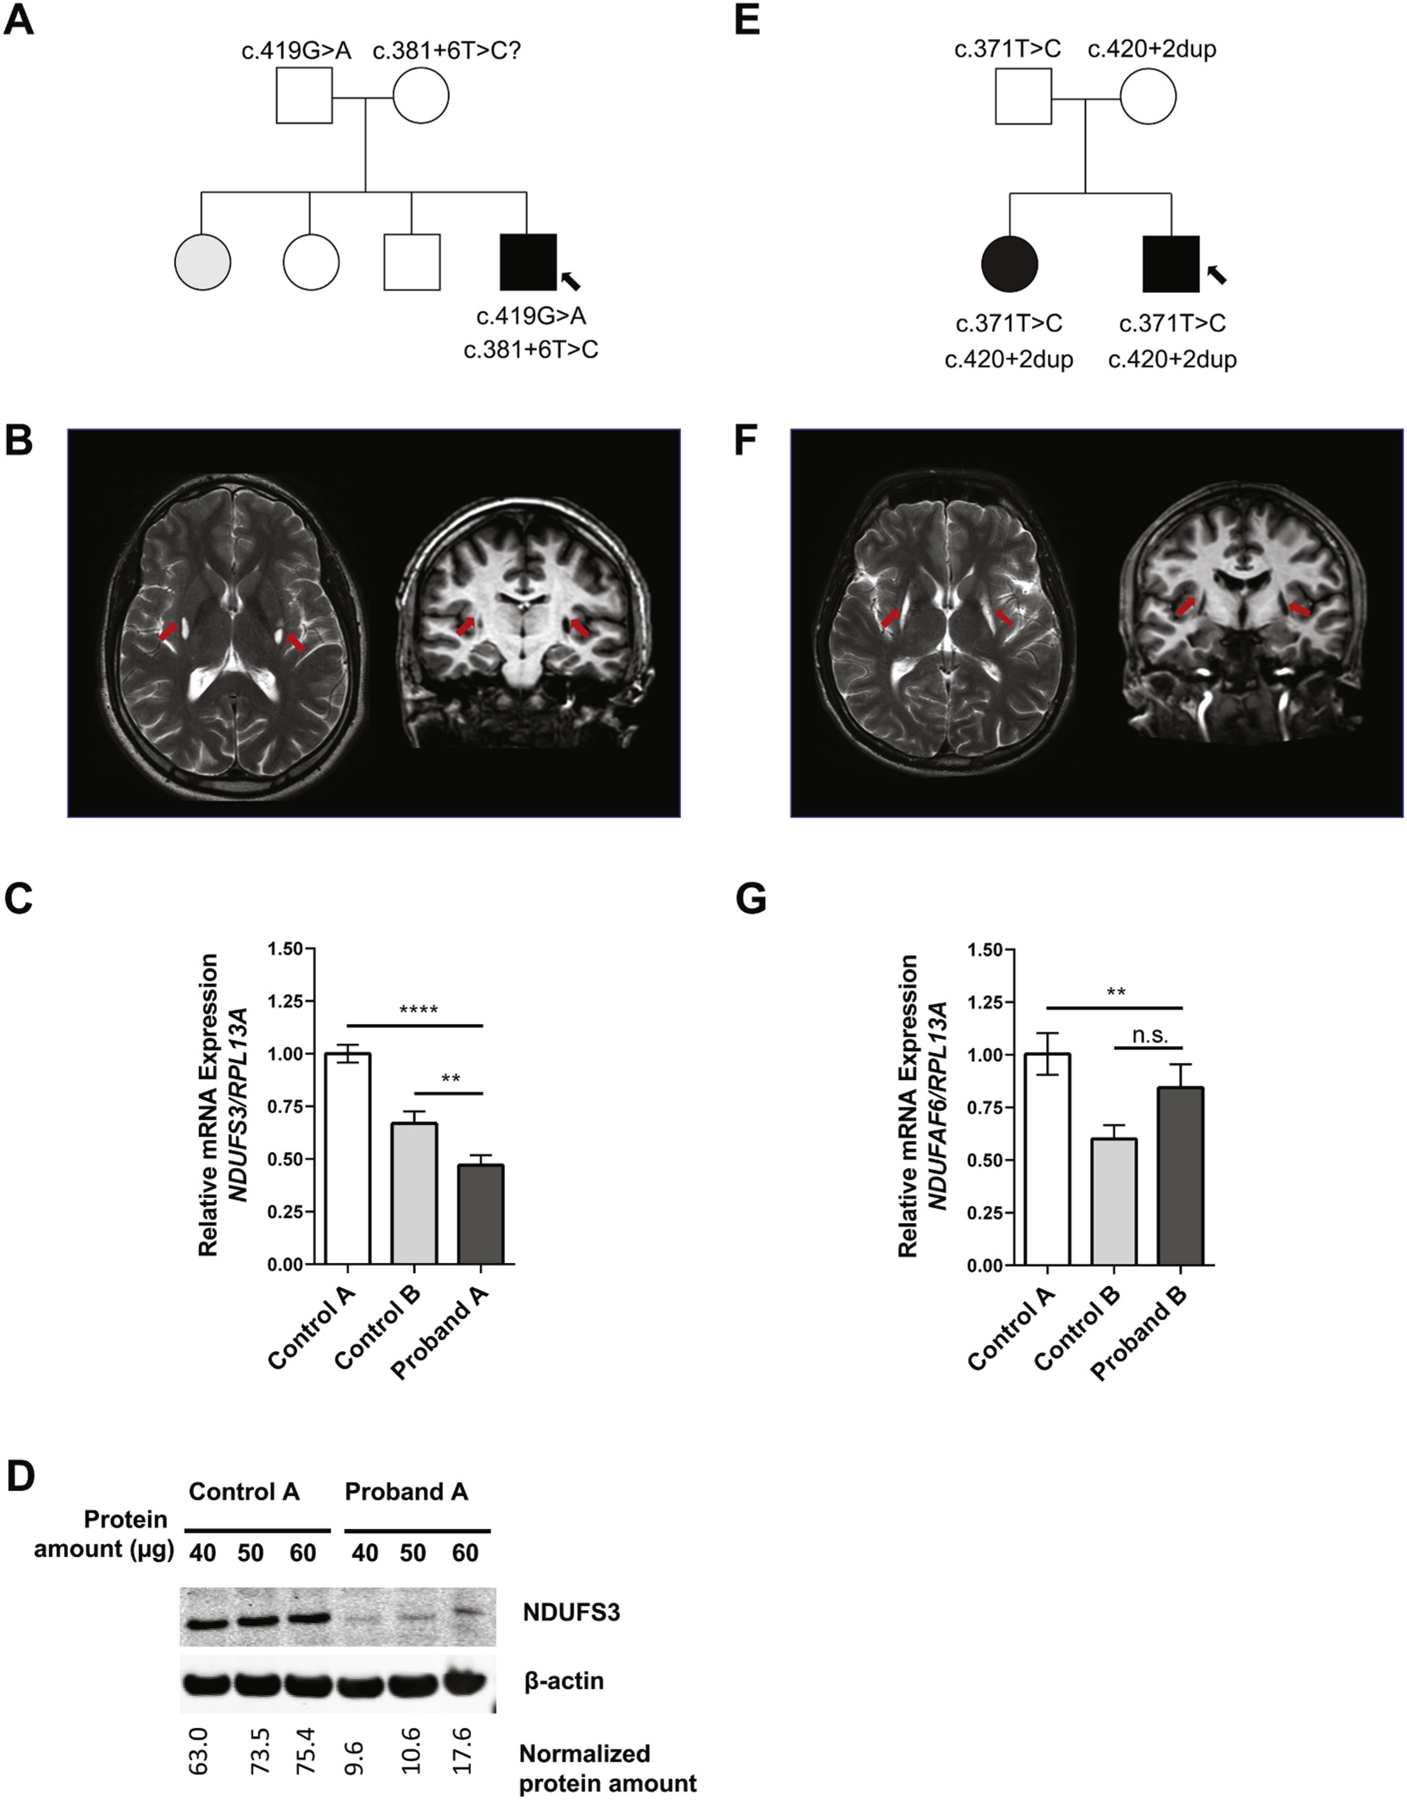
Fig. 1.

Clinical and Genetic Findings. (A) Pedigree for proband A’s family; affected members are shaded with black, and arrow points to proband A. (B) MRI images showing the characteristic T2 signal intensities in the basal ganglia of proband A (arrows). (C) mRNA expression analysis for NDUFS3 in proband A’s dermal fibroblasts as compared to unrelated control fibroblasts. Proband A displayed both a statistically significant reduction of mRNA compared to controls (****P < 0.001 in comparison to control A, **P < 0.01 in comparison to control B). Paired t-tests were conducted using GraphPad Prism8 software where asterisks indicate statistical significance. mRNA analysis was normalized to RPL13A. (D) Protein expression analysis show reduced amount of NDUFS3 (predicted to be at 25 kDa) in proband A as compared to control, normalized with (42 kDa). Three different protein amounts were loaded. (E) Pedigree for proband B’s family; affected members are shaded with black, and arrow points to proband B. (F) MRI images showing the characteristic T2 signal intensities in the basal ganglia of proband B (arrows). (G) mRNA expression analysis for NDUFAF6 in proband B’s dermal fibroblasts as compared to two unrelated control fibroblasts; mRNA analysis was normalized to RPL13A. Paired t-tests were conducted using GraphPad Prism8 software where asterisks indicate statistical significance (****P < 0.0001; **P < 0.01).
