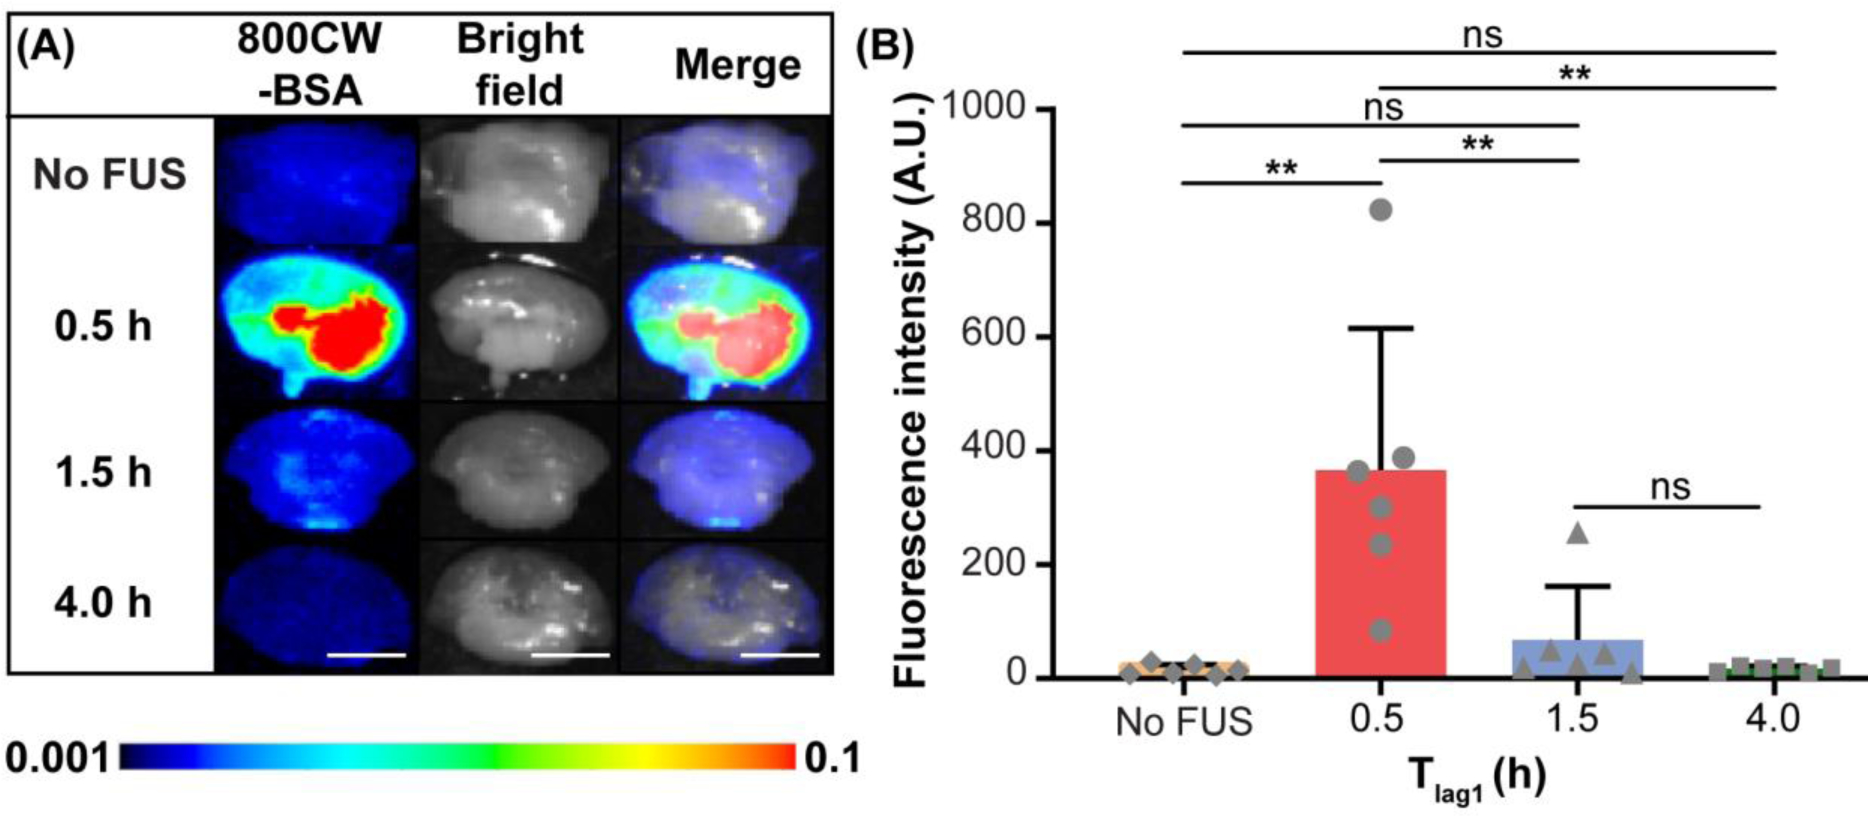
Figure 2.

FUSIN delivery of 800CW-BSA to the brainstem at different time intervals between IN and FUS (Tlag1) (groups 1, 2, 3, and 4 in Table 1). (A) Fluorescence images, bright field images, and their overlays of representative ex vivo mouse brainstem slices at different Tlag1. (B) Quantification of the 800CW-BSA fluorescence intensity at the brainstem for groups with different Tlag1 and the control (IN only) group without FUS (Mann–Whitney U test; **: P < 0.01;ns: not significant). The scale bar is 5 mm.
