
Figure 4.
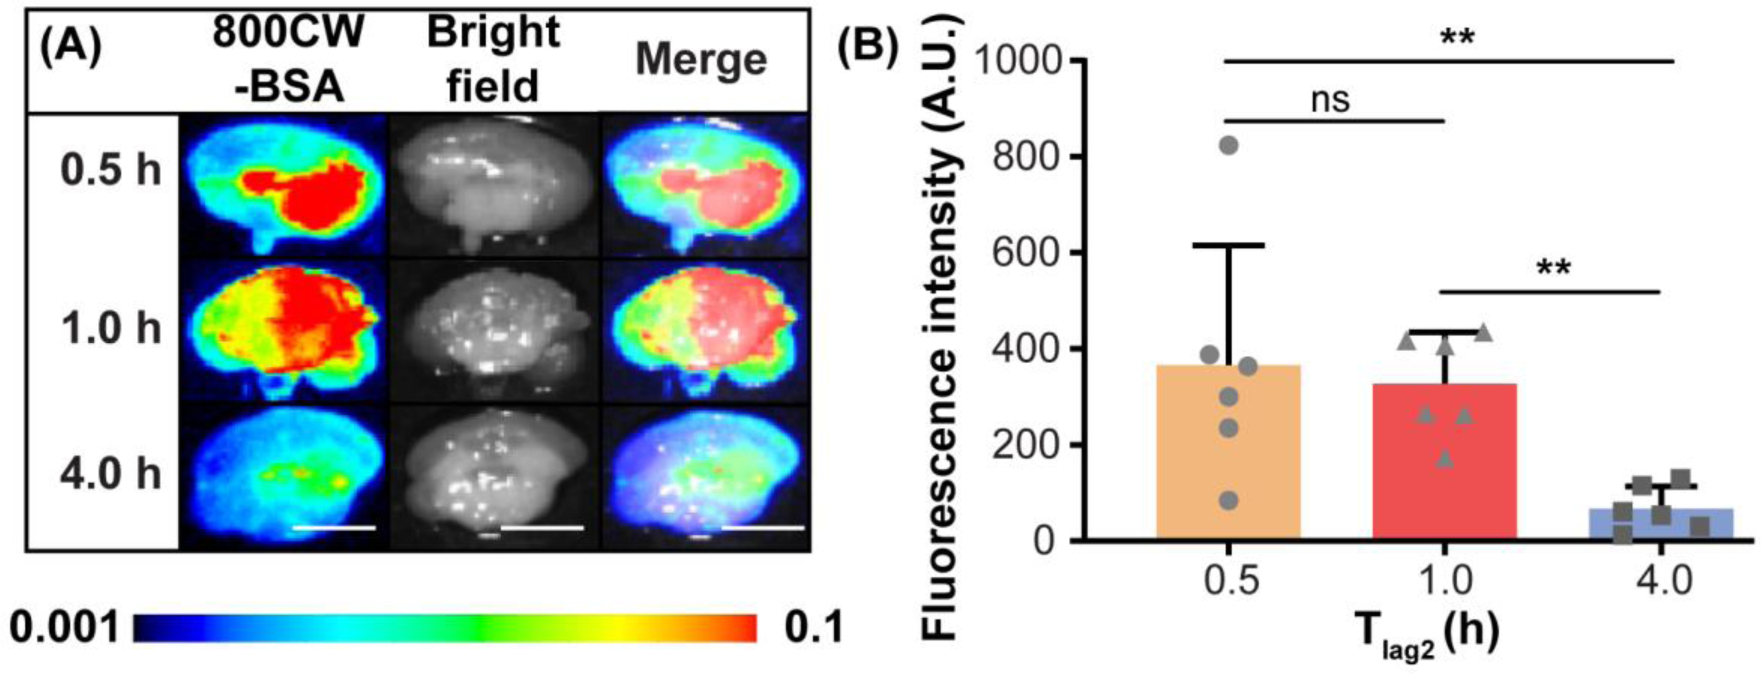
The pharmacokinetics of FUSIN-delivered 800CW-BSA at the brainstem (groups 2, 5, and 6 in Table 1). (A) Fluorescence images, bright field images, and their overlays of representative ex vivo mouse brain slices at the brainstem of mice sacrificed at different Tlag2. (B) Quantification of the 800CW-BSA fluorescence intensity for different Tlag2 groups (Mann–Whitney U test; **: P < 0.01; ns: not significant). The scale bar is 5 mm.