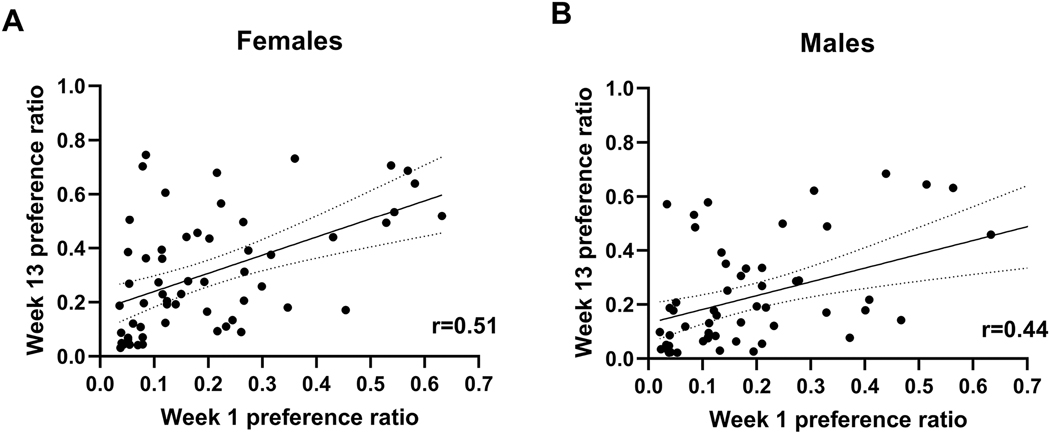
Figure 1. Ethanol preference during the first week of a chronic 3-month drinking trial modestly predicts ethanol preference in the final week.
Correlations are shown for (A) females and (B) males for the first (Week 1) and last (Week 13) weeks of the ethanol drinking trial. Pearsons correlations were significant (ps < 0.001). The solid line is the regression with the dotted lines representing the 95% confidence intervals. N=58 for females; N=56 for males

