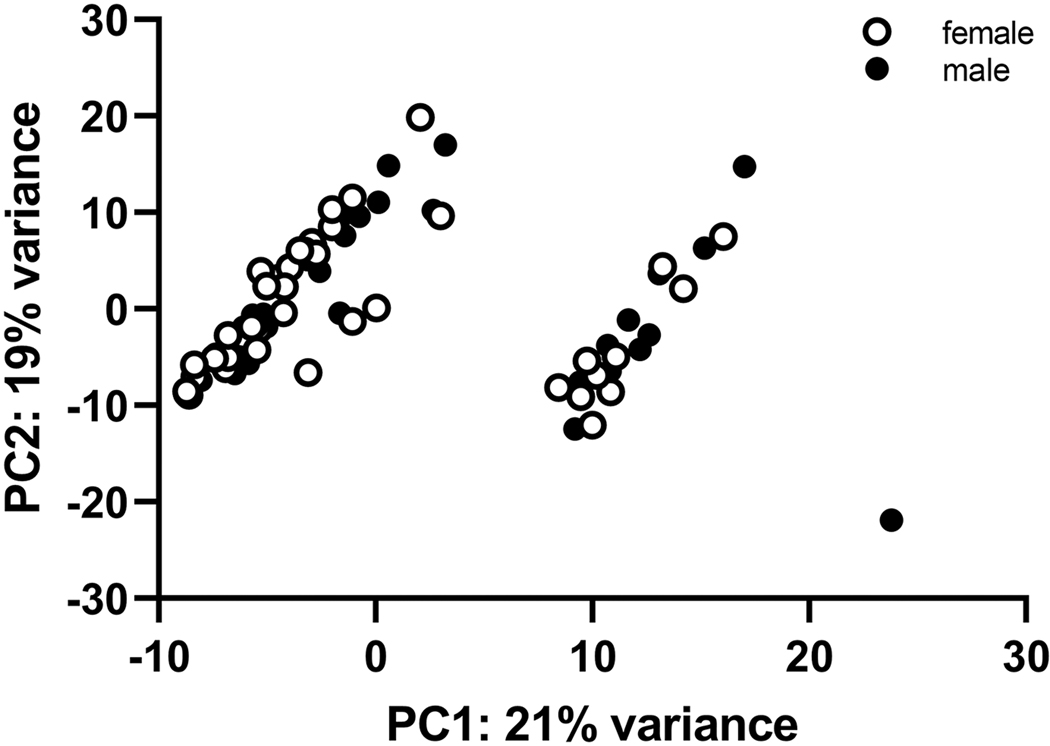
Figure 6. Principal components analysis separates RNA-Seq data for the central nucleus of the amygdala into two components for mice with varying levels of ethanol preference.
Component 1 (PC1) accounted for 21% of the variance and was formed from 33 female and 31 male samples. Component 2 (PC2) accounted for 19% of the variance and was formed from 10 female and 10 male samples.

