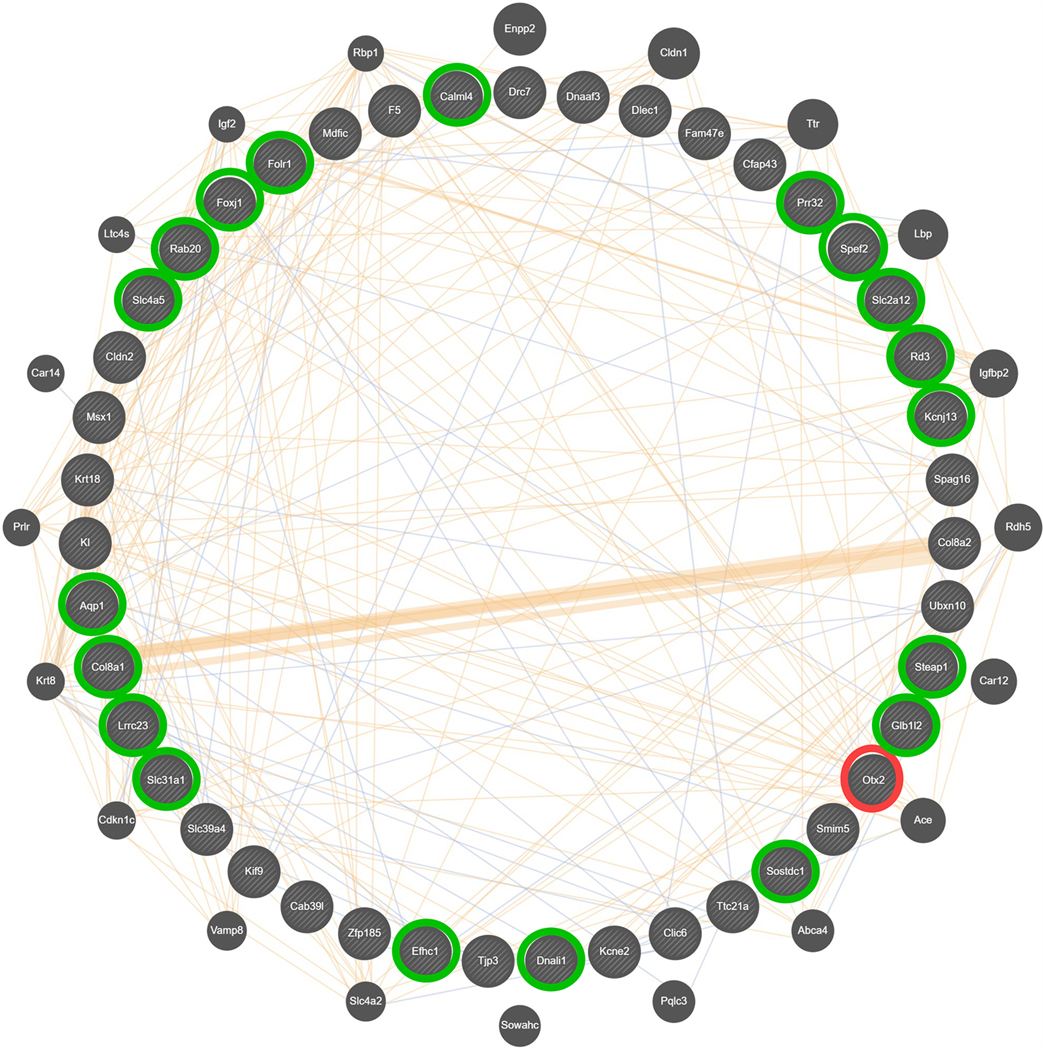
Figure 7. Composite gene-gene interaction network for differential expression in the CeA, associated with differences in ethanol preference in female HS-CC mice.

This network was created using GeneMANIA [80] and derived from 43 hub nodes (inner circle) found within the brown module, enriched in genes with an astrocyte annotation. The genes in the outer circle were identified by GeneMANIA [80] as functional associates, with symbol size, based on number of network connections. Otx2 (circled in red) was a top hub node and 19 other top hub nodes (circled in green) were down-regulated when Otx2 was absent. Blue lines represent known colocalization (5.47%) and tan lines represent predicted interactions (9.11%). The majority of network interactions are accounted for by co-expression (84.97%), which is the basis for the network. Since representation of co-expression obstructs visualization of colocalization and predicted interactions, co-expression is shown in Supplementary Information Figure S1.
