Figure 2.
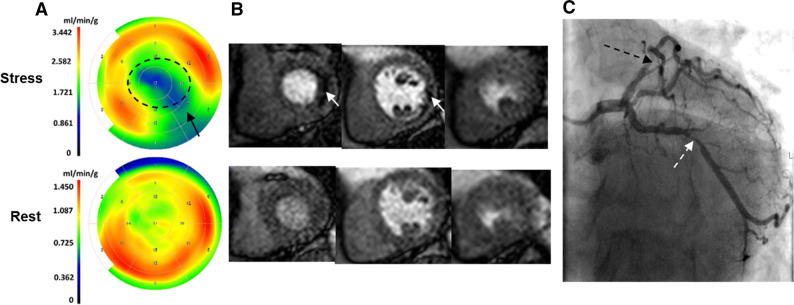
An example of a patient with a cardiac positron emission tomography (A) revealing abnormal myocardial blood flow at stress in both the LCX (black arrow) and LAD vessel territories (dashed circle). The bull’s eye plots represent the distribution of the quantified absolute myocardial blood flows (ml/min/g tissue) in the left ventricle. The color scales to the left of the bull’s eyes represent the flow ranges with warm colors indicating higher flows and cold colors lower flows. In this case first-pass perfusion-CMR (B) showed stress-induced ischemia only in the LCX territory (white arrows) while the angiogram (C) revealed a stenosis, evaluated as needing revascularization, in the LAD (dashed black arrow), not seen by CMR, in addition to a stenosis evaluated as needing revascularization in LCX (dashed white arrow)

