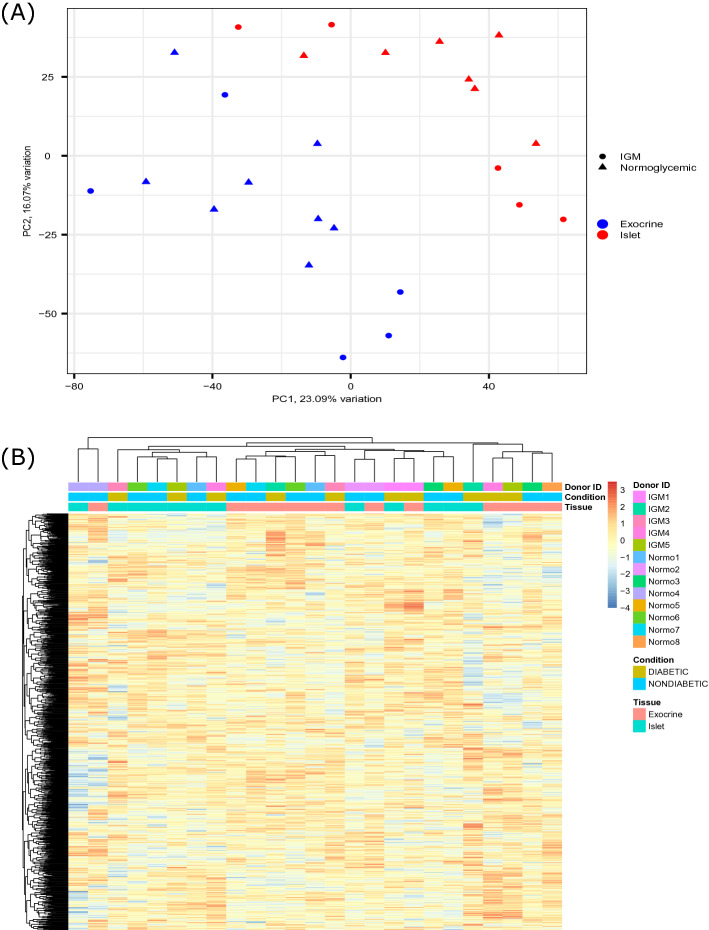
Figure 2.
(A) Principal component analysis showing sample variation in two-dimensional principal component space for the sorted islet and exocrine endothelial cell samples. PC1 accounts for 23.09% of the total variation and PC2 16.07% of the total variation exocrine endothelial cell samples. PC1 accounts for 23.09% of the total variation and PC2 16.07% of the total variation. Circles indicate samples from IGM (Impaired Glucose Metabolism) donors, triangles indicate samples from normoglycemic donors. Red indicates islet MVEC samples, blue indicates exocrine MVEC samples. n = 12 (islets) and n = 13 (exocrine). (B) Heatmap with hierarchical clustering of genes and samples using the 1000 genes with the most variance. Color intensity indicates expression level, given as z-score of CPM- TMM- normalized counts. The colored bars on top indicates donor ID, condition (glycemic status) and tissue of origin respectively. A trend towards clustering by tissue of origin is evident. When samples from exocrine and islet cluster together, they originate from the same donor. n = 12 (islets) and 13 (exocrine).

