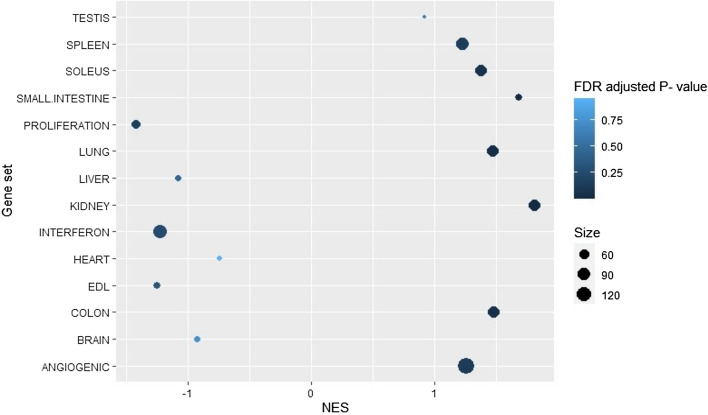
Figure 4.
Results of the gene permutation pre-ranked gene set enrichment analysis (GSEA) using 14 capillary endothelial cell marker sets derived from the murine endothelial cell atlas. 11 of the sets are dependent on tissue of origin while 3 are biological processes. Normalized Enrichment Score (NES) is indicated by the x-axis. Positive NES values indicate enrichment in islet MVECs, negative NES values indicate enrichment in exocrine MVECs. FDR adjusted p-value is denoted by the color of the dots. The sizes of the gene sets are indicated by the size of the individual dots. n = 12 (islets) and 12 (exocrine).

