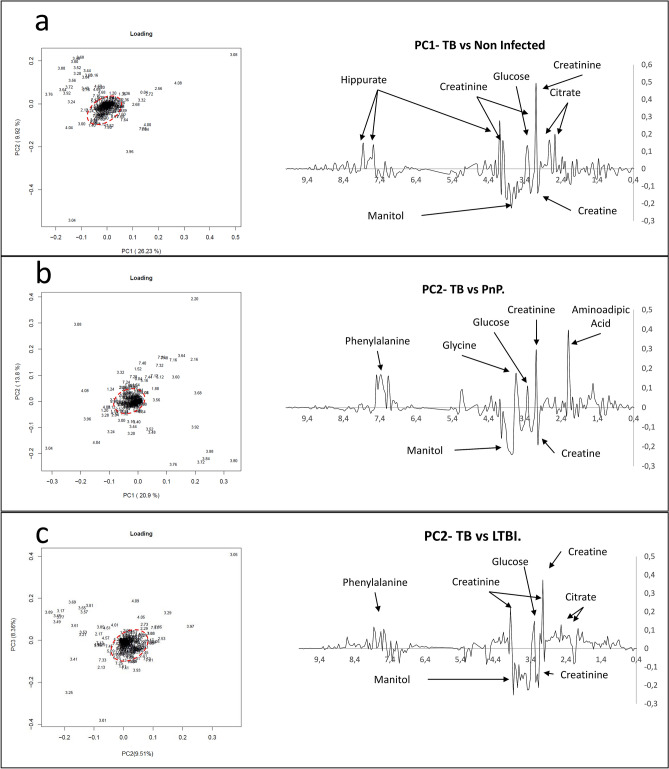
Figure 3.
Principal Component Analysis (PCA) loading plots of 89 urine spectra analyzed by high-field Nuclear Magnetic Resonance reveals the metabolomic fingerprint of TB corresponding to 31 chemical shift regions assigned to eight metabolites. (a) PCA loading PC1-PC2 biplot and PC1 loading plot between TB patients and uninfected individuals; (b) PCA loading PC1-PC2 biplot and PC2 plot between TB patients and patients with pneumococcal pneumonia (PnP); (c) PCA loading PC2-PC3 biplot and PC2 loading plot between TB patients and individuals with LTBI. Multiple regions for the discrimination between groups were pointed outside the boundaries of a Hotelling's T2 statistics ellipse (pointed red line) in PCA loading biplots. TB, tuberculosis; PnP, pneumococcal pneumonia; LTBI: latent TB infection; PC, Principal Component.

