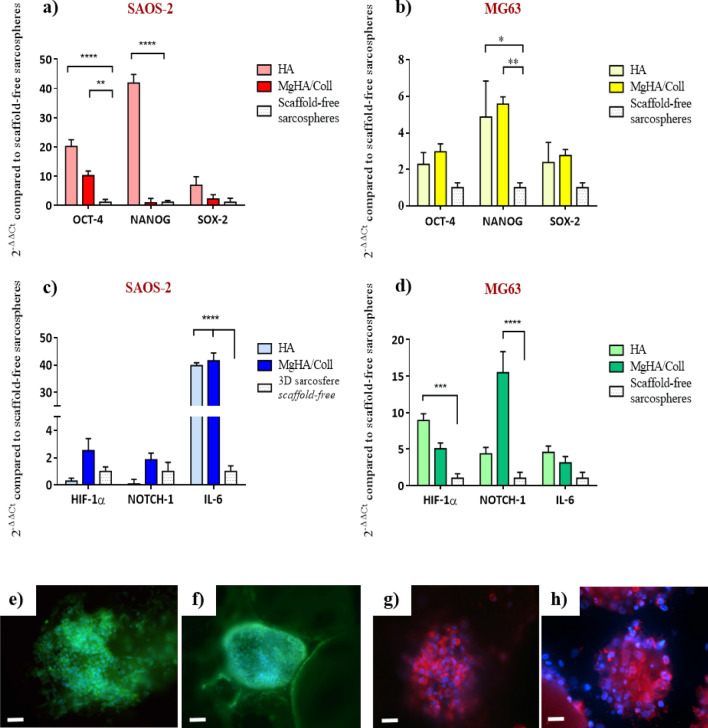
Figure 7.
Gene expression and protein immunofluorescence analysis of 3D sarcospheres scaffold-based models. Relative quantification of OCT-4, NANOG and SOX-2, stemness marker genes, SAOS-2 (a) and MG63 (b). Relative quantification of HIF-1a, NOTCH-1 and IL-6, CSCs niche-related genes, SAOS-2 (c) and MG63 (d). The graphs show the fold change expression of the genes relative to the scaffold-free sarcospheres at day 10 of culture (mean ± standard error; *p value ≤ 0.05; **p value ≤ 0.01; ***p value ≤ 0.001; ****p value ≤ 0.0001;). The panel shows a representative image of OCT-4 immunolocalization in SAOS-2 sarcorpheres MgHA/Coll model (e) and in HA model (f) scale bar 50 µm; SOX-2 immunolocalization in MG63 sarcorpheres MgHA/Coll model (g) and in HA model (h) scale bar 25 µm. Blu: cell nuclei; green: OCT-4; red: SOX-2.

