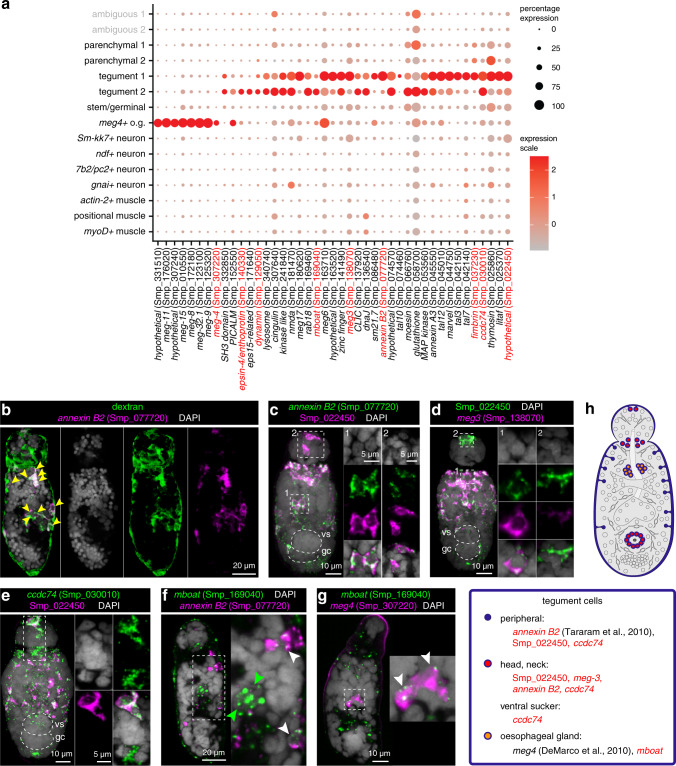
Fig. 3. Two distinct populations of tegumental cells in schistosomula.
a Expression profiles of cell marker genes that are specific to or enriched in the tegument clusters. Genes validated by ISH are marked in red. b annexin B2+ cells have taken up the fluorescent dextran. Yellow arrowheads indicate double-positive cells. Single confocal sections are shown. c Double FISH of Tegument 1 markers annexin B2 (Smp_077720) and Smp_022450. The majority of the cells show co-localisation (white signal). Left: MIP; right: zoomed in confocal sections. vs: ventral sucker; gc: germinal cell cluster. d Double FISH of Tegument 1 markers Smp_022450 and meg3 (Smp_138070). The majority of the cells show co-localisation (white signal). e Double FISH of Tegument 1 marker (Smp_022450) with ccdc74 (Smp_030010), MIP. The majority of cells show co-localisation (white signal), while a subset of cells in the neck region of the worm show single positive cells for Tegument 2 markers. f, g Double FISH of Tegument 2 marker mboat (Smp_169040) and f Tegument 1 marker annexin B2 (Smp_077720) and g oesophageal gland marker meg4 (Smp_307220), single confocal sections. Green arrowhead: mboat+ cells; white arrowhead: double-positive cells. h Schematic that summarises the tegument cell populations in 2-day old schistosomula. Marker genes identified in the current study are indicated in red. All previously reported genes are shown in black. The numbers of ISH experiments performed for each gene are listed in ‘Methods’ and Supplementary Data 7.

