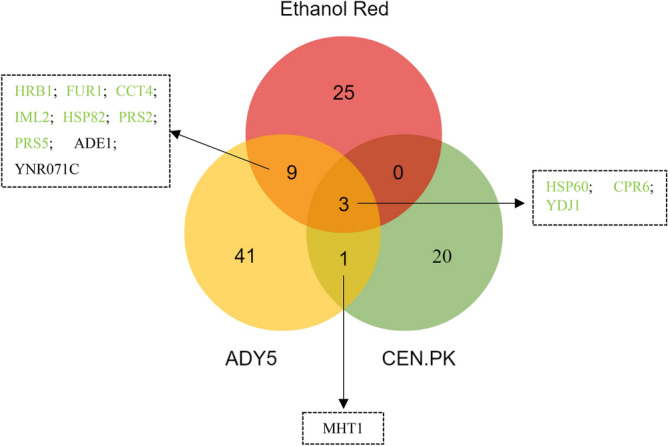
Figure 3.

Venn diagram representing the differentially expressed proteins identified in the three Saccharomyces strains cultivated at 39˚C, in anaerobic chemostat cultures. Proteins are colored according to significant change as follows: green (increased in both strains), or black (decreased in both strains). Image prepared using the Veny 2.1 (Oliveros, J.C. (2007–2015) Venny. An interactive tool for comparing lists with Venn's diagrams. https://bioinfogp.cnb.csic.es/tools/venny/index.html).
