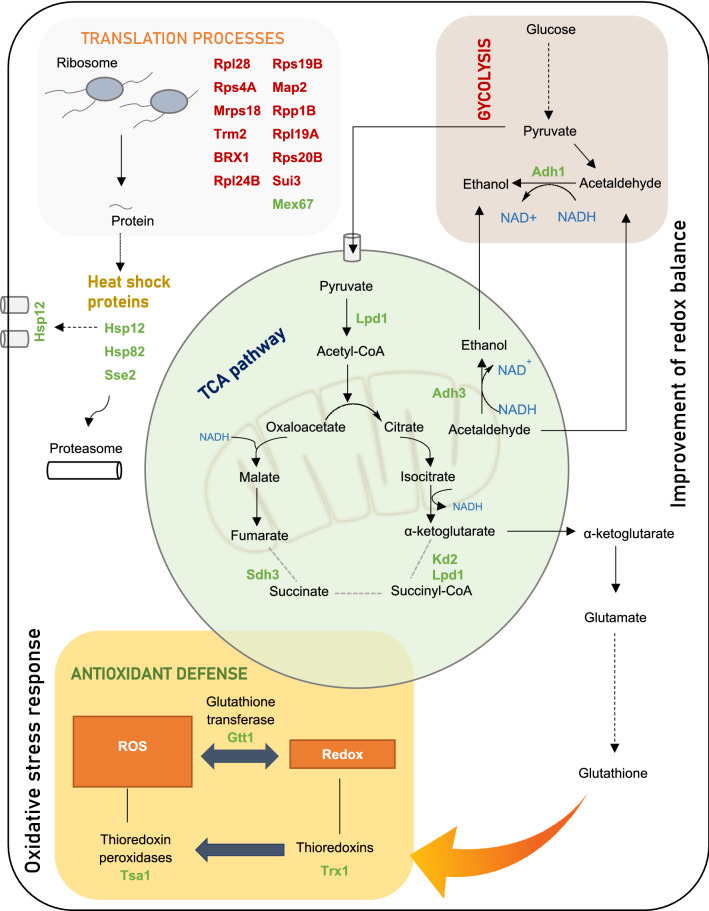
Figure 6.
A schematic illustration of the major pathways involved in the unique response of ADY5 to sub-optimal growth temperature (12 °C). Under anaerobic conditions, the TCA pathway operates as an oxidative branch and a reductive branch. Broken grey lines represent the point at which the cycle may be interrupted. The precise step of interruption in yeast cells is not yet identified. The proteins are highlighted in green (upregulated) or red (downregulated), indicating their enhancement or repression compared to the levels observed at control temperature (30 °C). In this figure are represented only the proteins significantly altered exclusively in ADY5 strain. The proteins common to other strains were not represented.

