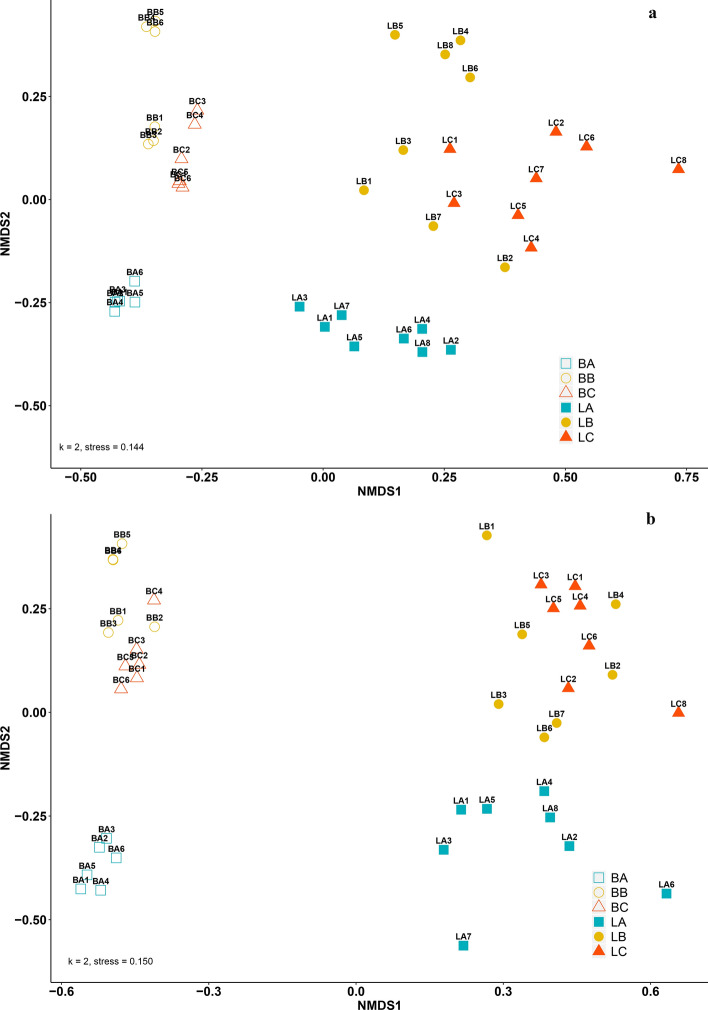
Figure 4.
Non-metric multidimensional scaling (NMDS) plot displaying β-diversity by Bray–Curtis dissimilarities for (a) prokaryotic and (b) fungal communities. Non-filled symbols show bulk soils (B), filled symbols show rhizosphere samples of L. decidua (L). Letters (A, B, C) indicate the site replicates and numbers represent the respective replicates within fraction, site and light treatment (e.g. BA1 stands for the community in bulk soils at forest site A and sample replicate 1). Numbers in bulk soils 1, 2, 3 stand for normal light and 4, 5, 6 for intensified light conditions. Numbers in rhizosphere samples 1, 3, 5, 7 indicate intensified light and 2, 4, 6, 8 normal light conditions.

