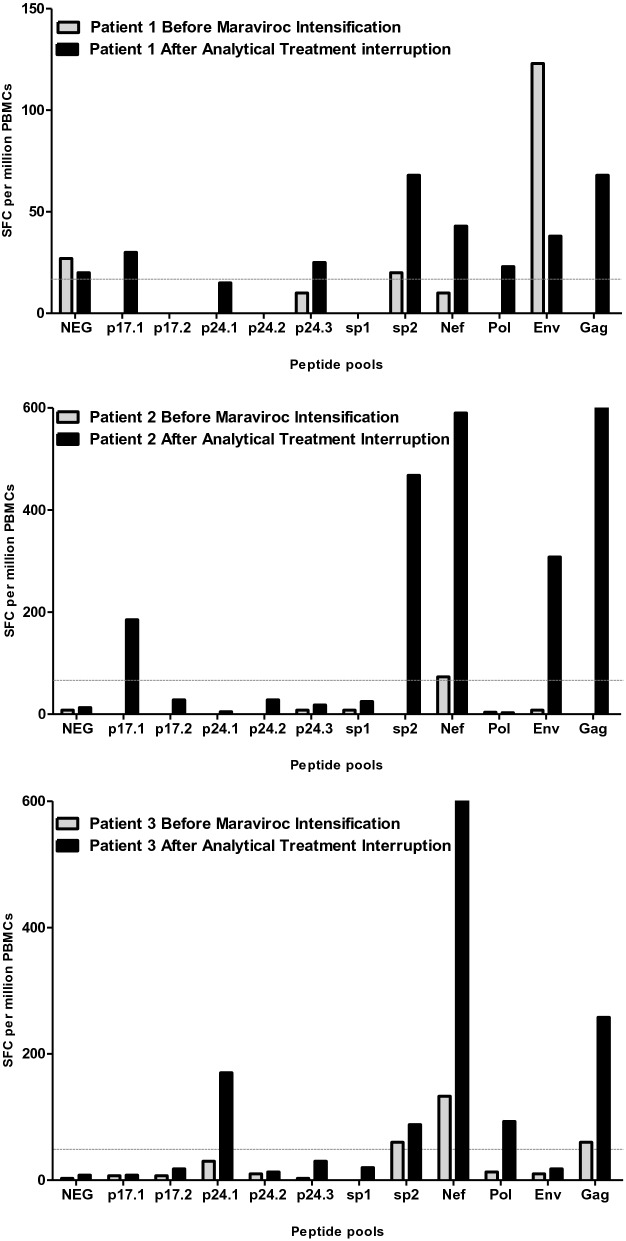
Figure 3.
HIV specific T lymphocyte response. The ELISpot assay, that quantifies interferon-γ secretion against different peptide pools covering p17, p24, sp1, sp2, gag, pol, nef and env sequences, was used. Samples were taken before the intensification with maraviroc during the initial study (grey bars) and when antiretroviral treatment was resumed after the ATI during the amended study (black bars). Data are are shown as the number of cells secreting interferon-γ against the indicated peptide per 106 peripheral blood mononuclear cells (PBMCs). The dotted grey line indicates the threshold for positivity (50 SFC per million PBMCs). SFC, spot forming cells.

