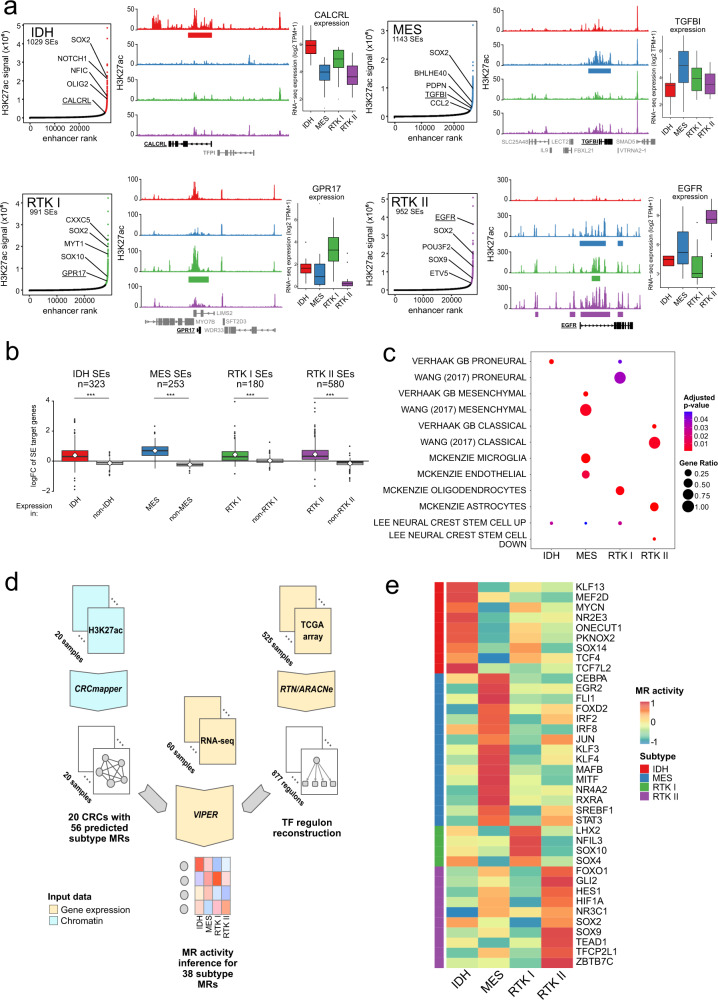
Fig. 3. Core regulatory circuitry analysis identifies primary glioblastoma subtype Master Regulators.
a Superenhancer (SE) identification using glioblastoma subtypes’ H3K27ac profiles. Left: Hockey stick plots showing enhancers (x-axis) ranked by their H3K27ac intensity (SES-normalised values, y-axis) are shown for the four subtypes. Selected SEs are labelled with their target genes. Centre: Exemplary subtype SEs, with mean subtype H3K27ac profiles for CALCRL (IDH), TGFBI (MES), GPR17 (RTK I) and EGFR (RTK II). Subtype SEs are depicted as coloured bars below each H3K27ac profile. Right: RNA-seq gene expression (log2 TPM + 1) for the indicated genes, by subtype, visualised as Tukey boxplots. IDH, n = 12; MES, n = 19; RTK I, n = 12; RTK II, n = 17 samples. Boxes correspond to the 25th, 50th/median and 75th percentiles; whiskers denote 1.5× the IQR from the median. Points mark outliers beyond 1.5× IQR. b Tukey boxplots showing the gene expression log FC (limma) for target genes of each subtype SEs (defined by ANOVA on H3K27ac signal, minimum log fold change 1, Benjamini–Hochberg adjusted P-value = 0.1), comparing expression in that subtype to the average of the other 3. Mean log FC is indicated by the white diamond; n indicates the number of target genes; Boxes correspond to the 25th, 50th/median and 75th percentiles; whiskers denote 1.5× the IQR from the median. Points mark outliers beyond 1.5× IQR. ***Two-tailed t-test, P-value <2.2 × 10⁻¹⁶. c Selected gene signature enrichment results for the target genes of each subtype’s SEs. The size of each circle corresponds to the ratio of SE target genes in that gene signature, while the colour represents the adjusted P-value. d Overview of subtype Master Regulator (MR) identification. Firstly, 56 MRs were predicted with CRCmapper on the tumour H3K27ac profiles (n = 20). We extended this MR activity inference to the full tumour cohort (n = 60 samples) using VIPER to predict these 56 MRs’ activity within a gene regulatory network inferred in the TCGA cohort (n = 525 samples). In total, 38 subtype MRs were identified. e Heatmap showing the mean subtype activity for each MR (n = 38).

