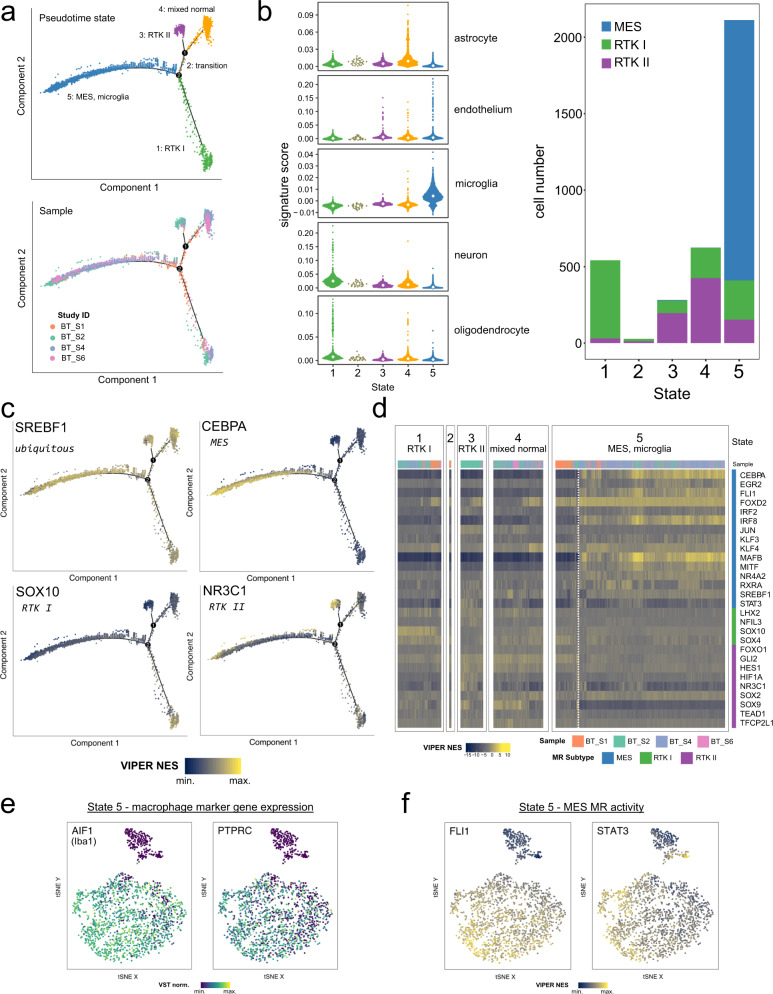
Fig. 4. Validation of core regulatory circuitry Master Regulator predictions using glioblastoma single-cell RNA-seq.
a Pseudotime trajectory inferred with monocle using QC-filtered single cells from the Darmanis (2017)25 glioblastoma dataset. At top, the cells are coloured by the inferred pseudotime state. Below, cells are coloured by their source sample in the original study. b Assignment of glioblastoma subtype and normal cell identities to pseudotime states. Normal brain cell type signature scores (McKenzie et al., 2018)28; median scores are indicated by the white diamond; left), and subtypes assigned based on the VIPER-inferred activity of CIMP- CRC MRs (n = 25 analysable MRs) in the TCGA gene regulatory network were calculated for each cell. c Visualisation of relative MR activity (SREBF1, ubiquitous, top left; CEBPA, MES, top right; SOX10, RTK I, bottom left; NR3C1, RTK II, bottom right) on the pseudotime trajectory. The scaled VIPER NES was calculated for each MR using each cell’s expression profile and the RTN-derived regulons. d Heatmap visualisation of VIPER NES for the n = 28 CIMP- subtype CRC MRs, split by state. Each column corresponds to a single cell and is annotated with the source tumour sample. Within each state, samples were clustered by their activity profiles. The dashed white line delineates two subpopulations of cells in state 5 with differing MR activity. e tSNE projection of the MES tumour and TAM/microglial single cells in pseudotime state 5 (n = 2112) using the MES CRC MR (n = 13) activity matrix. Each cell is coloured by its relative expression of the macrophage markers AIF1 (left) and PTPRC (right). f As in (e), but coloured by the scaled MR activity (VIPER NES) of FLI1 (left) and STAT3 (right).

