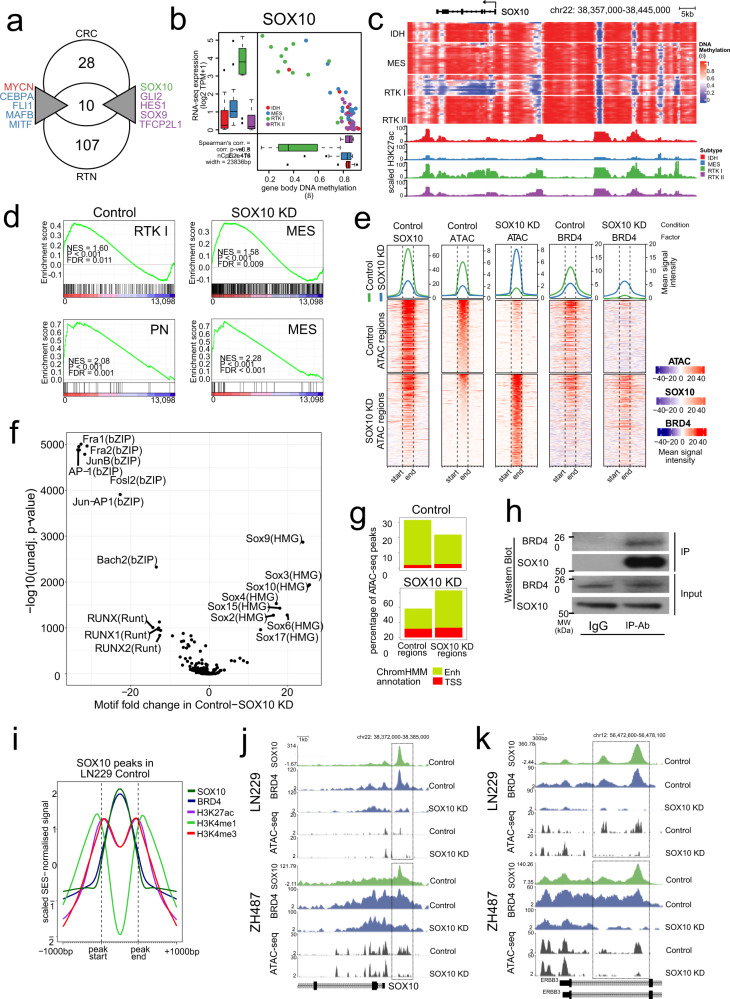
Fig. 5. SOX10 is a Master Regulator of the RTK I subtype.
a Consensus Master Regulators. b Correlation of DNA methylation and SOX10 expression within the SOX10 gene body. Boxes in Tukey plots correspond to the 25th, 50th/median and 75th percentiles; whiskers denote 1.5× the IQR from the median. Points mark outliers beyond 1.5× IQR.IDH, n = 12; MES, n = 19; RTK I, n = 12; RTK II, n = 17 samples. c Epigenome landscape of SOX10 in glioblastoma. Per-sample methylation (WGBS beta, top) and subtype mean H3K27ac intensity (SES-normalised, bottom) are shown. d GSEA plots showing enrichment of proneural and mesenchymal gene signatures in control and SOX10 KD LN229 cells. Upper row: limma subtype signatures of tumour cell-specific gene expression; lower row: tumour cell-specific signatures of Wang et al. (2017)5. GSEA-calculated statistics for gene set enrichment are shown. P-values (all < 0.001) and FDR values were computed empirically using a permutation test (n = 1000 permutations) based on the enrichment score. e EnrichedHeatmap visualisation of genome regions with differential chromosome accessibility in LN229 control and SOX10 KD cells, as identified by ATAC-seq analysis. SES-normalised signals of SOX10 ChIP-seq, ATAC-seq and BRD4 ChIP-seq are displayed. Signal intensity is shown in the blue–red heatmaps, where each row shows a single ATAC peak, as indicated by the vertical dashed lines, and 1 kbp further 5′ and 3′. The lineplots at the top of each heatmap display the mean signal intensity across all the regions in that category (control: green; SOX10 KD: blue). f Volcano plot of de novo motif finding with HOMER from the differentially bound ATAC-seq peaks in LN229 cells. The significantly enriched motifs are labelled. g ChromHMM annotations of LN229 ATAC-seq peaks. Active TSS (E01–E04) and Enhancer (E07–E11) states in the NT (left) and SOX10 KD conditions (right) are shown. h Western blot of SOX10 and BRD4 co-immunoprecipitation in the cell line LN229 (two independent experiments). i Factor co-occupancy at SOX10 peaks in LN229. The SES-normalised signal for peak regions and 1 kbp up and downstream for SOX10, BRD4, H3K27ac, H3K4me1 and H3K4me3 were separately scaled. j, k Changes in SOX10 and BRD4 binding and ATAC-measured chromatin accessibility at the RTK I subtype genes SOX10 (j) and ERBB3 (k). SES-normalised ChIP-seq and ATAC-seq signal is shown in the NT and SOX10 KD conditions in the LN229 (top) and ZH487 (bottom) cell lines. The boxes indicate regulatory regions where SOX10, BRD4 and ATAC-seq signal change in a co-ordinated manner.

