Fig. 2.
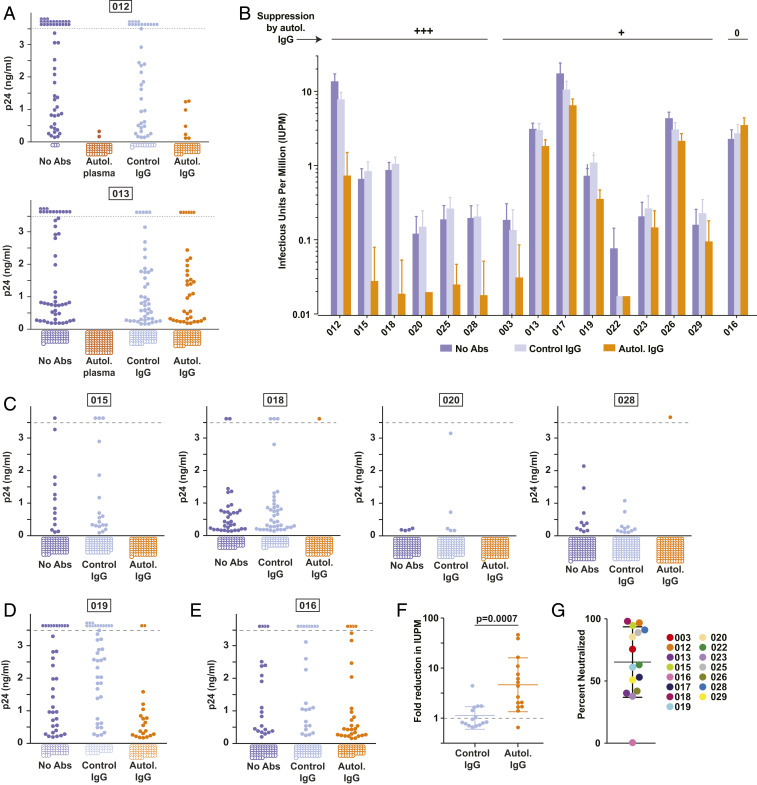
Autologous plasma and purified autologous IgGs inhibit viral rebound in QVOAs. (A) QVOAs for two participants (012 and 013) set up under four conditions: no antibodies added, autologous plasma (1:50 dilution), control IgG from HIV-negative donors (50 μg/mL), and purified autologous IgG (50 μg/mL). Graphs show p24 values in the culture supernatants from individual wells at the end of the 14- to 21-d culture and include data from all dilutions except those at which most (>60%) wells were positive under all conditions. The dotted line indicates the upper limit of quantification for the p24 ELISA. Off-scale positive wells are shown above the dotted line. Negative wells are shown as open circles below the graph. (B) Frequency of CD4+ T cells giving rise to viral outgrowth in cultures without antibodies, with control IgG (50 μg/mL), or with autologous IgG (50 μg/mL). Results of QVOAs are expressed as estimated infectious units per million (IUPM) cells ± SD calculated using maximum likelihood (see Methods). (C) Supernatant p24 levels for representative participants showing strong suppression (>80%) of viral outgrowth by autologous IgG. (D) Representative culture data for a donor (019) showing weak suppression of outgrowth by autologous IgG. (E) Culture data for donor 016, who showed no suppression of outgrowth by autologous IgG. (F) Fold change in IUPM relative to cultures without antibody. Each symbol represents a different donor. Bars indicate geometric mean ± SD. (G) Estimated fraction of latent proviruses that fail to grow out in the presence of autologous IgG for each study participant calculated on the basis of the reduction in IUPM. Bars indicate mean ± SD.

