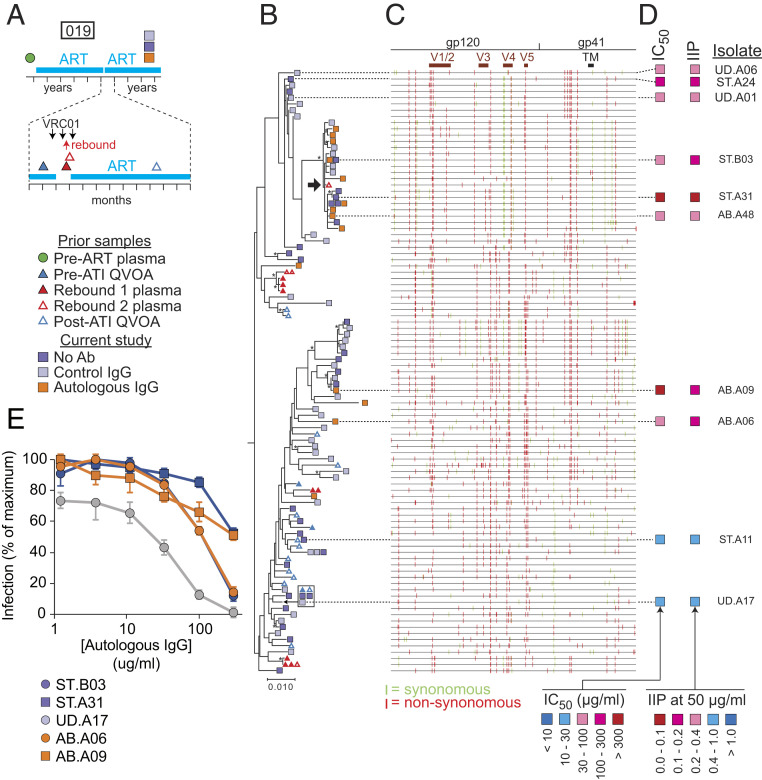
Fig. 5.
Phylogenetic analysis and neutralization sensitivity of isolates from participant 019. (A) Sampling time line. Participant 019 was part of a previous trial of bNAb VRCO1 that included a treatment interruption (57, 60). Times of VRC01 infusion and viral rebound are indicated by black and red arrows, respectively. Symbols indicate times of pre- and post-ATI QVOA samples, rebound plasma samples, and QVOA samples for the current study. (B) Maximum likelihood phylogenetic tree with midpoint rooting of full-length env sequences from the current study and the VRC01 study. One rebound sequence (black arrow) is closely related to several sequences growing out in the presence of autologous IgG in the current study. The bar indicates substitutions per site. Bootstrap values greater than 70% are indicated by an asterisk. (C) Highlighter plot indicating synonymous (green) and nonsynonymous (red) nucleotide differences relative to a participant consensus sequence. Positions of the variable loops (V1 to V5) in gp120 and the transmembrane (TM) domain in gp41 are indicated. (D) Results of neutralization assays on pseudoviruses generated with the env sequences of the indicated isolates. Neutralization is quantified as the concentration of autologous IgG required for 50% neutralization (IC50); and the instantaneous inhibitory potential (IIP), the number of logs of inhibition produced by autologous IgG at 50 μg/mL. See also SI Appendix, Table S3. (E) Representative dose–response curves for the inhibition of infectivity of participant 019 pseudoviruses by autologous IgG. Pseudoviruses were generated from representative isolates from a standard (ST) QVOA set up without antibodies, a QVOA set up with control IgG from uninfected donors (UD), or a QVOA set up with autologous IgG antibodies (AB). Pseudoviruses were used to infect Tzm-bl cells (70, 71) in the presence of the indicated concentrations of autologous IgG. IC50 and IIP values were calculated using the median effect model (72). Data are plotted as mean ± SD. See also SI Appendix, Table S3.

