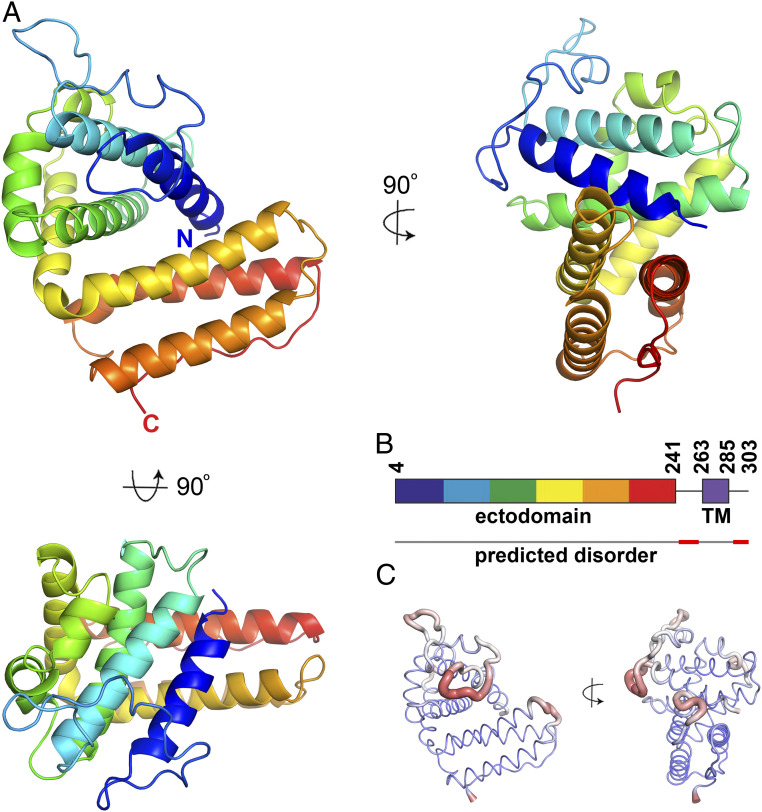
Fig. 1.
The structure of a P. chabaudi PIR protein. (A) The structure of the CIR protein ectodomain from PCHAS_1200500 is shown in rainbow representation, with the N terminus in blue and the C terminus in red. (B) A schematic of the full CIR protein PCHAS_1200500 showing the ectodomain (rainbow) and the transmembrane helix (TM; purple). Below the schematic is a line representing the predicted disorder across the domain, with disordered regions in red. (C) The structure of the CIR domain represented as a wire, with the thickness scaled according to the crystallographic B factor of this region of the model. Broad, red regions of wire indicate more disordered regions of the protein domain.

