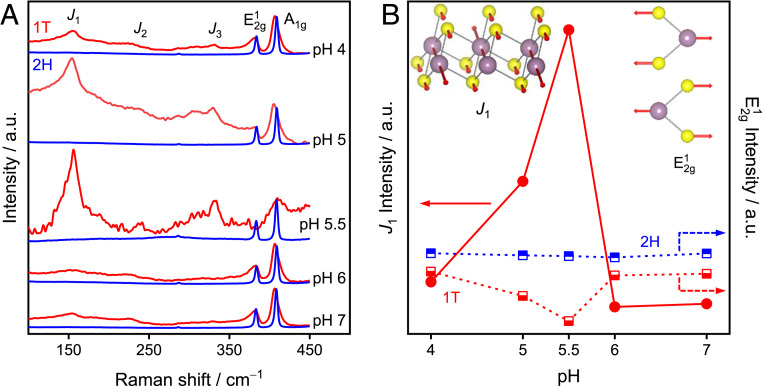
Fig. 7.
Raman spectra of MoS2. (A) Raman spectra of 1T-MoS2 (red lines) and 2H-MoS2 (blue lines) generated after reduction by 20 mM dithionite at different pH conditions. (B) Raman signal intensity of J1 and E2g1 as a function of pH. (Inset) The corresponding phonon vibration mode of J1 and E2g1. Experimental conditions: 532-nm laser; coadditions, 20 spectra; integration time, 10 s.

