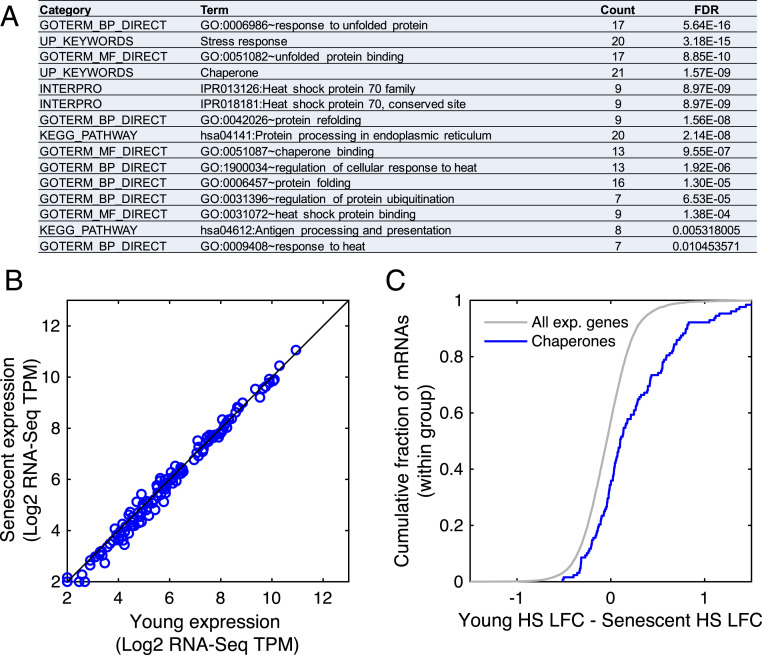
Fig. 2.
HS-mediated induction of chaperones is impaired in senescent cells. (A) A functional enrichment analysis of the proteostasis decline cluster performed using DAVID showed that the cluster is characterized by stress response genes and chaperones. (B) There was no significant difference between the mRNA expression levels (log2 RNA-Seq TPM) of all chaperones in young versus senescent samples (P = 1, Kolmogorov-Smirnov goodness-of-fit [KS] test). A manually curated chaperones list (157 chaperones) is in SI Appendix, Table S5; similar results were obtained with the chaperone list from Brehme et al. (22), see SI Appendix, Fig. S3 C and D. (C) A CDF plot of the difference between the HS fold changes (log2 TPM HS/Control, denoted as LFC) between young and senescent cells, demonstrating that chaperones are overall more highly induced in young cells (P = 1.4−9, KS test).

