Fig. 6.
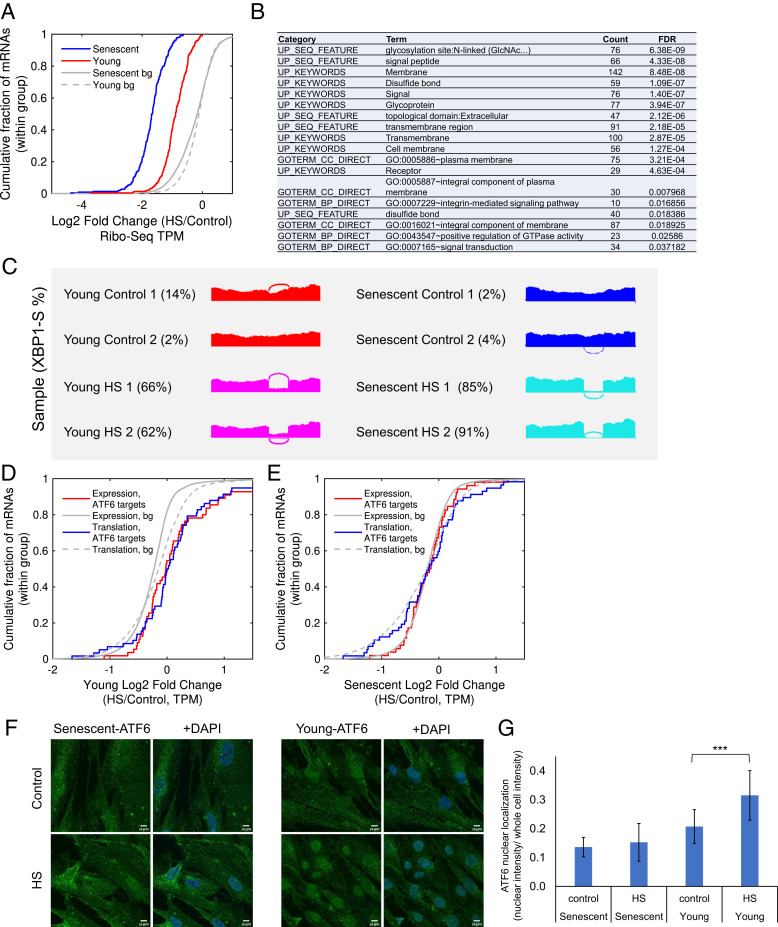
Loss of coordination between UPR branches in senescent cells upon HS. (A) A CDF plot of the log2 translation fold changes (HS/Control, Ribo-seq TPM) for mRNAs from the senescence-enhanced HS repression cluster (Fig. 5, black cluster), shown for senescent (blue) and young (red) cells. The gray lines depict the corresponding CDF plots for the background distribution (bg), that is, all translated mRNAs in senescent (solid gray line) or young (gray dashed line) cells. The repression was significantly stronger in senescent than young cells (P = 5.9−44, Kolmogorov-Smirnov goodness-of-fit test [KS] test). (B) A functional enrichment analysis of the senescence-enhanced HS repression cluster was performed using DAVID and showed that the cluster was highly enriched with ER targets. A full list of annotations is available in SI Appendix, Table S4. (C) A splicing plot (Sashimi plot (26)) of XBP1 exon four (of the unspliced isoform). The PSI values of the spliced XBP1 isoform for all samples, as quantified using MISO (26), are indicated: 2%, 4% (senescent), 85%, 91% (senescent HS), 2%, 14% (young), 66%, and 62% (young HS). The significance of change was quantified by MISO and resulted in the following BFs: the BFs for HS versus Control samples were 1,012 for all comparisons; the BFs for senescent versus young were 1.9 and 0.1, indicating no basal difference in the extent of XBP1-spliced; and the BFs for senescent-HS versus young-HS were 14,717 and 3.810. (D and E) CDF plots of the log2 fold change (HS/Control) of the set of bona fide ATF6 target genes (taken from ref. 31) demonstrate their significant induction upon HS in young cells (D) both at the mRNA (red) and the translation (blue) levels (P = 1.7−5 and P = 1.1−3 for mRNA expression and translation, respectively, using KS test). No induction was observed in senescent cells (E, P = 0.87 and P = 0.77 for mRNA expression and translation, respectively, using KS test). (F) ATF6 immunofluorescence confocal microscopy imaging showed increased nuclear localization in young HS cells with a diminished trend in senescence. DAPI marks the nuclei. Additional fields are shown in SI Appendix, Fig. S7 K–AH. (Scale bar, 10 μm). (G) An image analysis was performed on immunofluorescence images. The mean and SD of ATF6 nuclear localization are presented, calculated as the sum of fluorescence intensity in the nuclei divided by the sum of fluorescence intensity in whole cells (see Materials and Methods), with a total of 16, 17, 19, and 20 images taken for young, young HS, senescent, and senescent HS samples, respectively, from three biological replicate experiments. Significance was calculated using a t test; ***P = 2 × 10⁻⁴. The data for the three separate replicates is shown in SI Appendix, Fig. S7 AI and AJ.

