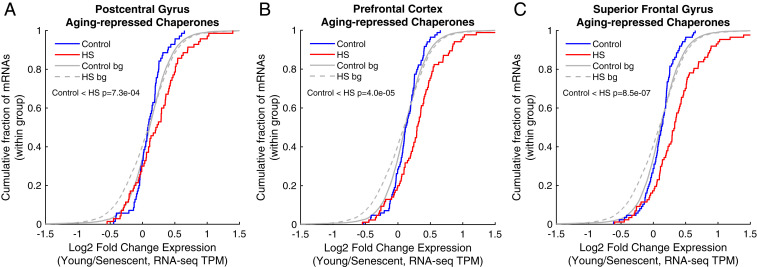
Fig. 8.
The signature of repressed chaperones in aged human brains shows a proteostasis decline behavior in human senescence. Age-repressed chaperones were taken from Brehme et al. (22), as defined for three different brain regions: (A) postcentral gyrus, (B) prefrontal cortex, and (C) superior frontal gyrus. The CDF plots depict the log2 expression fold changes of the mRNAs in this signature in young/senescent, either in untreated (blue) or HS (red) cells. bg, background distribution. These chaperones show a proteostasis decline behavior in human senescent cells: they were significantly more induced in HS in young versus senescent cells, and therefore the HS curve is significantly shifted. On the other hand, aged-induced chaperones from the same tissues show no significant differences between young and senescent cells (SI Appendix, Fig. S9).

