Fig. 2.
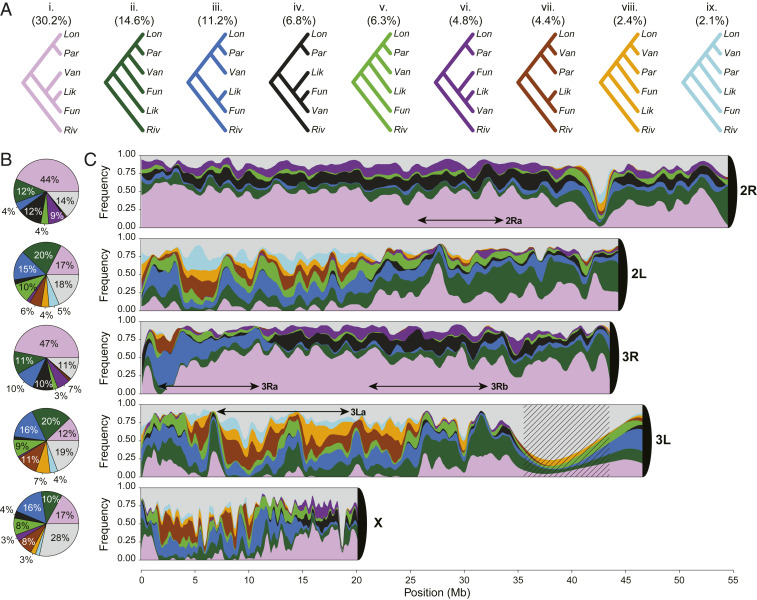
Frequency and distribution of gene trees. Phylogenetic trees were reconstructed in 5 kb nonoverlapping windows along the chromosomes using PhyML. Color coding of topologies is consistent across panels. (A) Nine major topologies (i–ix) found on any chromosome arm with a frequency of at least 5%. Normalized whole-genome frequencies are indicated in parentheses. (B) The frequency of each major topology on individual chromosome arms. Less frequent topologies are pooled together and displayed in gray in B and C. (C) Chromosome painting representing the frequency of topologies across chromosome arms. For display purposes the frequencies are averaged across adjacent windows. Approximate locations of common chromosomal inversions in An. funestus (3Ra, 3Rb, 3La, and 2Ra) are indicated by double-headed arrows. Centromeres are represented as black 1/4 circles. Hatching represents a masked region. An. funestus (Fun), An. funestus-like (Lik), An. longipalpis C (Lon), An. parensis (Par), An. vaneedeni (Van), and An. rivulorum (Riv).

