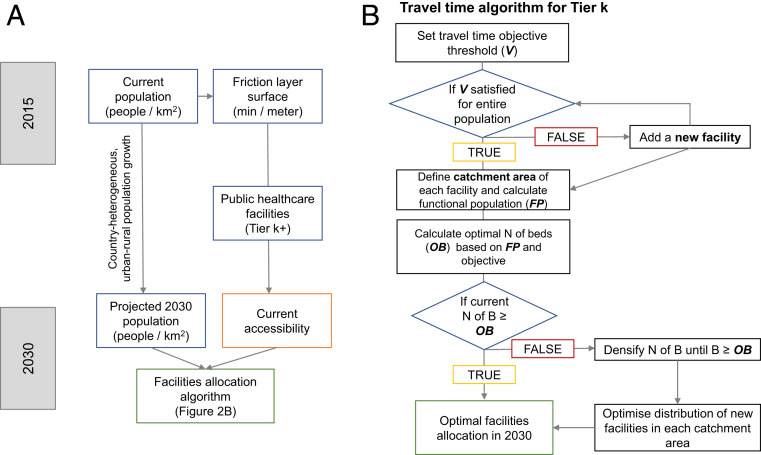
Fig. 2.
Schematic framework of the data inputs and the process of the multiobjective optimal allocation GIS algorithm. (A) Main input data sources and their processing. (B) Tree of the optimization algorithm aiming at identifying the optimal allocation of public health care facilities in 2030. B also describes the main geospatial data inputs required by the algorithm. For each facility in Tier K (or higher), a corresponding travel time threshold objective (V minutes) is set. Then, new facilities are added in Tier K until the condition that the entire (or a user-defined share of) population is served within V minutes. Subsequently, the CA of each facility—the area around each facility where V is satisfied—is identified. The population living within each CA (i.e., FP) is calculated, and where CAs of different facilities intersect, an equal subdivision of the shared population is carried out to avoid double counting. Thereafter, the optimal number of beds (OB) in each CA is calculated based on the local FP and the global hospital beds objective per 1,000 people. Finally, in those CAs where the local facilities are not meeting the beds constraint, a densification process is carried out, where further facilities are added locally. Here, diamond-shaped boxes designate conditional statements and rectangles identify processing steps.

