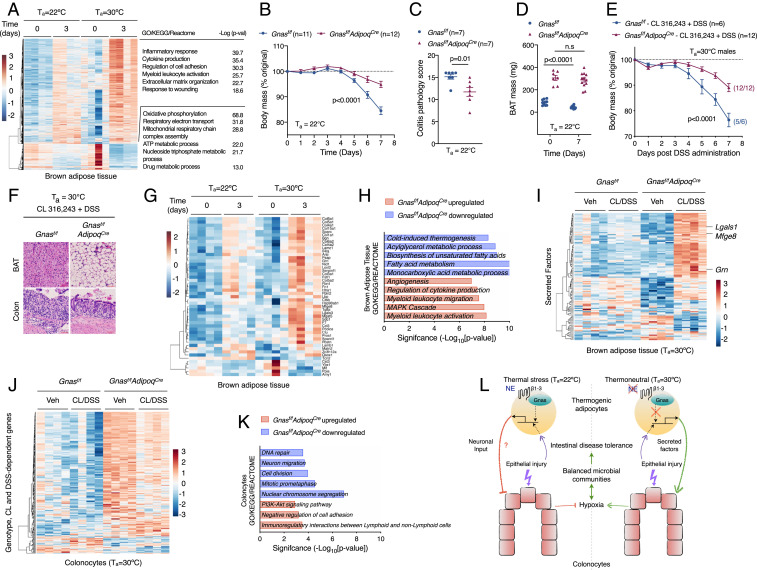
Fig. 5.
Adrenergic signaling in thermogenic adipocytes regulates intestinal disease tolerance. (A) Heat map, GO enrichment analysis, and corresponding P values of differentially expressed genes in BAT of C57BL/6J male mice that were administered DSS at Ta = 22 °C and Ta = 30 °C (n = 4 per time point and condition, fold change ≥1.5, adjusted P value <0.05). (B–D) Colitis was induced with 3% DSS in male and female Gnasf/f and Gnasf/fAdipoqCre mice housed at Ta = 22 °C. Body mass (B; n = 11 to 12 per genotype; data pooled from n = 2 independent experiments and analyzed by two-way ANOVA), colitis pathology score (C; n = 7 per genotype and analyzed by Student’s t test), and BAT mass (D; n = 7 to 12 per genotype; data pooled from n = 2 independent experiments and analyzed by Student’s t test). (E and F) Colitis was induced with 4% DSS in male and female Gnasf/f and Gnasf/fAdipoqCre mice housed at Ta = 30 °C that were treated with CL 316,243. Body mass (E; n = 6 to 12 per genotype; data pooled from n = 2 independent experiments and analyzed by two-way ANOVA) and representative pictures of H&E-stained sections of BAT and colon (F). (Scale bar: 100 μM.) (G) Heat map of differentially expressed secreted factors in BAT of C57BL/6J male mice housed at Ta = 22 °C and Ta = 30 °C that were administered DSS for 3 d (n = 4 per time point and condition, fold change ≥1.5, adjusted P value <0.05). (H–K) RNA-seq analysis of BAT and colonocytes isolated from thermoneutral Gnasf/f and Gnasf/fAdipoqCre mice treated with vehicle or CL 316,243 that were administered DSS for 4 d (n = 4 per condition, fold change ≥1.5, adjusted P value <0.05). GO enrichment analysis (H) of up-regulated and down-regulated genes in BAT of Gnasf/fAdipoqCre mice (H) and heat map of secreted factors (I) in BAT of Gnasf/f and Gnasf/fAdipoqCre mice. Heat map (J) and GO enrichment analysis (K) of colonocytes in thermoneutral Gnasf/f and Gnasf/fAdipoqCre mice (n = 4 per condition, fold change ≥1.5, adjusted P value <0.05). (L) Model depicting the thermogenic fat–epithelial cell axis that regulates intestinal disease tolerance. Thermogenic adipocytes integrate adrenergic and injury signals to modulate expression of factors that promote intestinal disease tolerance in thermoneutral mice. During injury, these factors act directly or indirectly on colonocytes to maintain epithelial hypoxia, which helps to maintain balanced microbial communities in disease-tolerant thermoneutral animals. NE, norepinephrine; β1–3, β1–3 adrenergic receptors. Data are presented as mean ± SEM.

