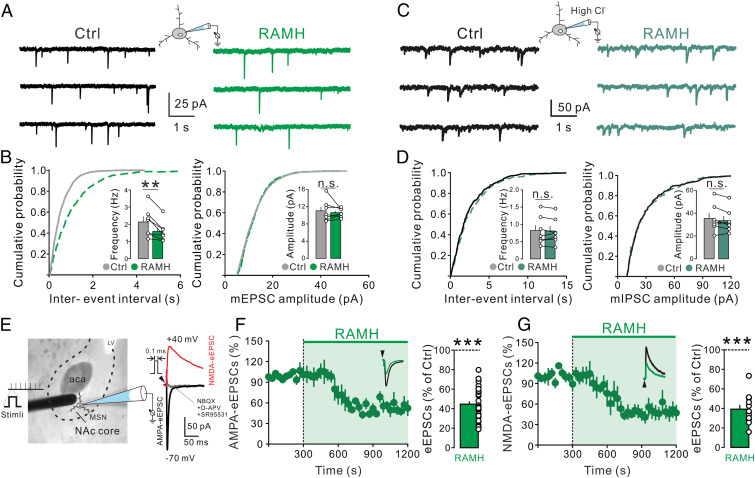
Fig. 3.
H3 receptor activation inhibits the glutamatergic synaptic transmission in the NAc core neurons. (A) The mEPSCs recorded in a NAc core neuron before and during the application of H3 selective agonist RAMH (3 μM) in the presence of TTX and SR95531. (B) Plots of the cumulative distribution of the interevent interval and amplitude for the neuron illustrated in A showing RAMH decreased the frequency of mEPSC rather than the amplitude. Inset summary graphs show the average mEPSC frequency and amplitude in the absence and presence of RAMH (n = 7). (C) Raw current traces showing mIPSCs recorded in a NAc core neuron before and during the application of H3 agonist RAMH (3 µM) in the presence of TTX, NBQX, and d-APV. (D) Interevent interval and amplitude distribution for the neuron illustrated in C showing RAMH did not affect the mIPSC frequency or amplitude. Inset summary graphs show the average mIPSC frequency and amplitude in the absence and presence of RAMH (n = 7). (E) The placement of a stimulating electrode and a recorded NAc core neuron. Raw traces show AMPA or NMDA receptor-mediated eEPSCs recorded from the NAc core neurons. (F and G) Bath application of RAMH (3 μM) decreased the amplitude of AMPA (F, n = 29) and NMDA eEPSC (G, n = 12). Scatterplots and bar graphs show the effect of RAMH on AMPA and NMDA eEPSCs in the NAc core neurons. Data are shown as means ± SEM; **P < 0.01, ***P < 0.001, n.s., no statistical difference.

