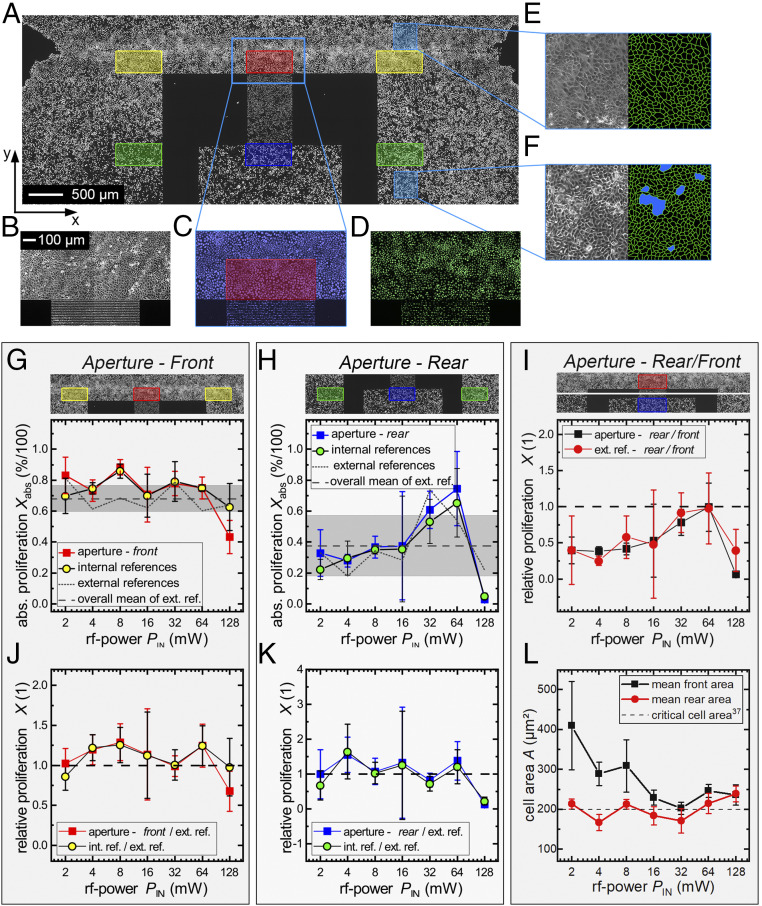
Fig. 5.
Determination of the SAW-induced influence on cell proliferation. (A) Fluorescence image of nuclei with newly synthesized DNA with evaluated regions marked in different colors (red: front aperture; yellow: internal reference front; blue: rear aperture; green: internal reference back). (B–D) Images of the artificial wound in phase contrast (B), all cellular nuclei (C), and newly synthesized (D). (E and F) Phase-contrast images and cell border of the cell layer. (E) MDCK-II at low density (wound). (F) MDCK-II at high density with emerging cell domes (blue spots). (G and H) Absolute proliferation Xabs(PIN) of the front and rear area. (I) Relative proliferation inside the cell layer and at the edge. (J and K) SAW-stimulated samples compared to external references. (L) Average area per cell in the corresponding external reference in the front and rear section of the aperture. Cultivation time for measurement point at PIN = 16 mW is t = 22 h; otherwise, t = 27 h.

