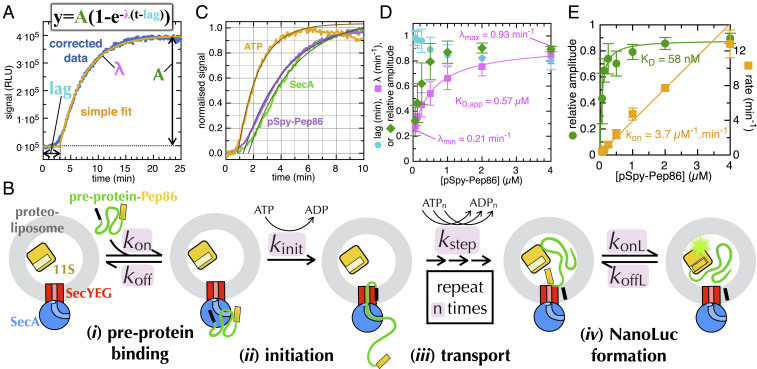
Fig. 1.
The NanoLuc transport assay. (A) An example NanoLuc transport curve with simple fitting. (B) The minimal model used to describe preprotein import in the NanoLuc assay. (C) Transport initiated by the addition of ATP (orange), pSpy–Pep86 (purple), or SecA (green). The lines represent best fit to the single exponential plus lag model. (D) Fitted λ (pink squares), A (green diamonds), and lag (cyan circles) as a function of pSpy–Pep86 concentration. Error bars represent the average and SEM from four repeats. λ is fitted to a weak binding equation. (E) The secondary data from a titration of pSpy–Pep86 against 200 pM 11S in solution. The fits are to a weak binding equation for A (green circles) and a straight line for rate (orange squares).

