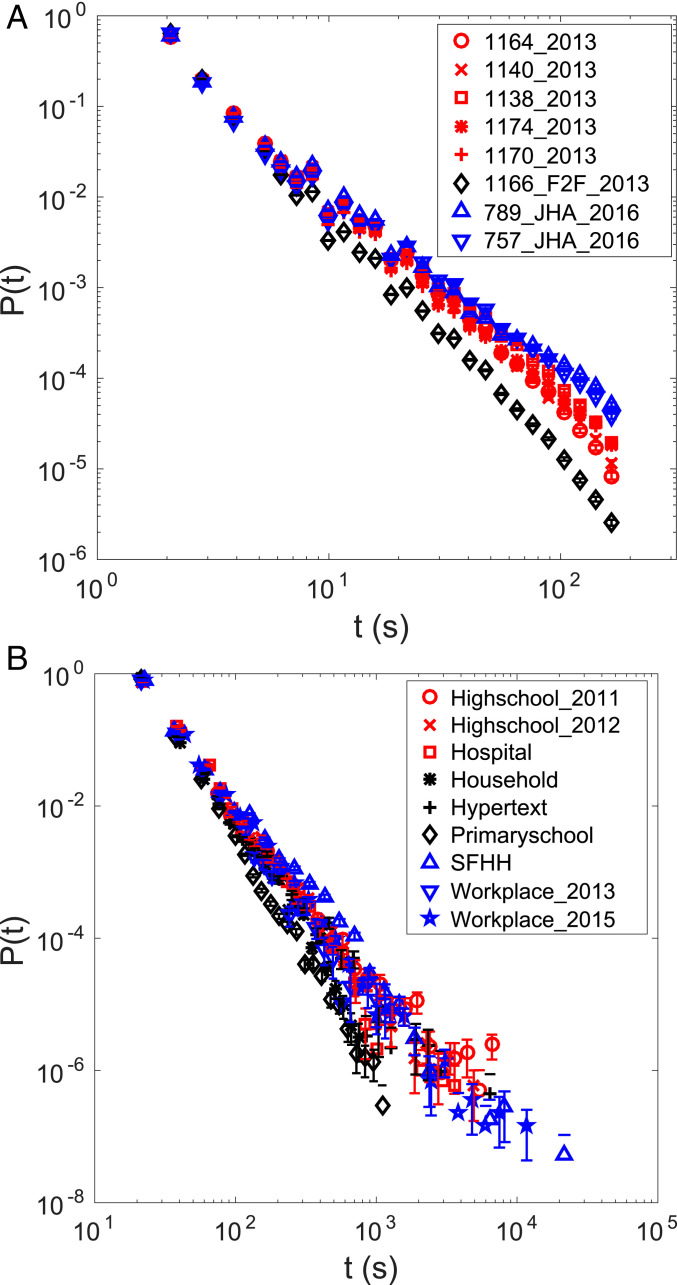
Fig. 1.
(A) Duration of trophallaxis as well as F2F events that are not detected as trophallaxis follows a heavy-tailed distribution. The first number in the dataset name represents the number of observed honeybees in each colony, while the last number represents the year the experiment was performed. Note that the number of individuals in the last two datasets is actually smaller than what was originally observed (676 and 639 instead of 789 and 757, respectively) because we analyzed the data after applying an additional filter to exclude the time series during which the colonies were perturbed by the treatment of JHA, but we decided to keep the name of the datasets. The numbers of interactions used to make the plot are 302,221, 205,787, 191,795, 259,923, 329,170, 1,207,778, 136,529, and 115,965 in the order the datasets are listed in the legend. (B) Human face-to-face (F2F) interaction in various settings exhibits a heavy-tailed distribution. The numbers of interactions used are 10,677, 19,774, 14,037, 32,425, 9,865, 77,520, 26,039, 4,591, and 33,750 in the order the datasets are listed in the legend. In both A and B, error bars indicate the SE. In B, lower error bars for bins with count 1 could not be drawn in logarithmic scale because it extends to 0.

