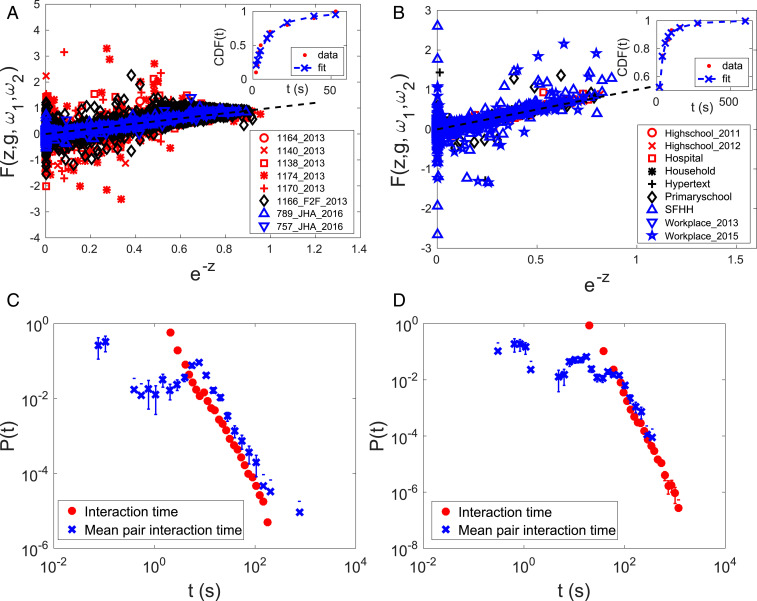
Fig. 3.
(A) Pair interaction time distributions for honeybee pairs are fitted to hyperexponential functions and collapsed together. The numbers of pairs used to generate the plot are 197, 99, 328, 443, 561, 1,806, 46, and 20 in the order the datasets are listed in the legend. The pair interaction time distributions of these pairs were fitted. (Inset) Fitting ECDF of pair interaction times of a pair from . (B) The same plot as A but with human pairs. The numbers of pairs used are 37, 82, 59, 58, 39, 143, 98, 15, and 171 in the order the datasets are listed in the legend. (Inset) Fitting ECDF of pair interaction times of a pair from Highschool. (C) Comparison between the scaling of interaction time distribution and mean pair interaction time distribution for . (D) The same plot as C but for Primaryschool. The number of mean pair interaction times used is the same as the number of pairs used for fitting, which is listed in A and B. The number of interaction times used is the same as what is listed in Fig. 1. Error bars indicate the SE, and lower error bars for bins with count 1 could not be drawn in logarithmic scale because it extends to 0.

