Fig. 2.
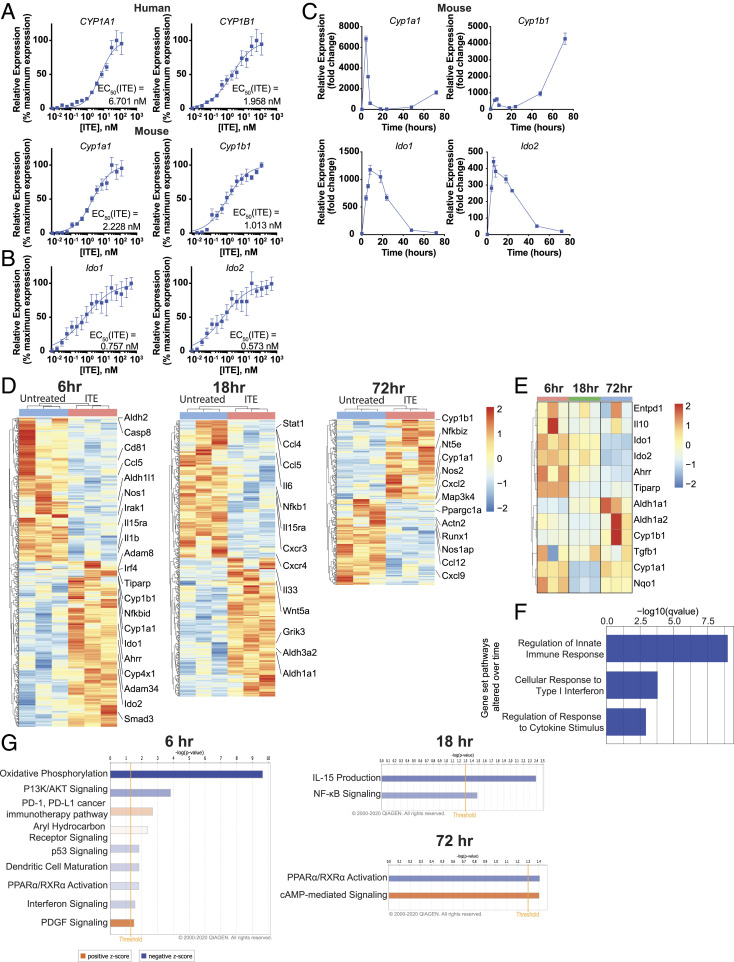
Temporal regulation of gene expression by AhR ligands in murine DCs. (A) mRNA expression of AhR target genes Cyp1a1 and Cyp1b1 in human peripheral blood DCs or murine splenic DCs following incubation for 6 h with ITE. Data were normalized to Gapdh, made relative to untreated samples, and presented here as a percentage of maximal induction. Data show the average of three independent experiments with DCs isolated from one independent healthy human donor per experiment or a pool of DCs isolated from the spleens of 10 healthy B6 mice. (B) mRNA expression of AhR target genes Ido1 and Ido2 in murine splenic DCs following incubation for 6 h with ITE. Data were normalized to Gapdh, made relative to untreated samples, and presented here as a percentage of maximal induction. Data show the average of two independent experiments with DCs isolated from spleens of 10 healthy B6 mice per experiment. (C) mRNA expression of AhR target genes Cyp1a1, Cyp1b1, Ido1, and Ido2 in murine splenic DCs following incubation with 100 nM ITE for 0, 4, 6, 8, 18, 24, 48, and 72 h. Data are normalized to Gapdh and relative to time 0. Data are means ± SEM of one experiment representative of two independent experiments. (D) Heat map of differentially regulated genes determined by 3′ DGE-seq RNA-seq in murine splenic DCs isolated from three different pools of 10 mice each and treated for 6, 18, or 72 h with 100 nM ITE. Gene expression is row centered, log2 transformed, and saturated at −2 and +2 for visualization. (E) Heat map of the expression of 12 genes known to be regulated by AhR activity as determined by 3′ DGE-seq RNA-seq in murine splenic DCs treated with 100 nM ITE for 6, 18, or 72 h. Gene expression is row centered, log2 transformed, and saturated at −2 and +2 for visualization. (F) Pathways identified by gene set enrichment analysis which were significantly altered over time following treatment in murine splenic DCs treated with ITE. (G) Ingenuity pathway analysis of the transcriptional profile of murine splenic DCs treated with ITE for 6, 18, or 72 h. Pathways associated with positive z-score are in orange; pathways associated with negative z-score are in blue; the relative strength of the z-score is represented by the intensity of the color.

