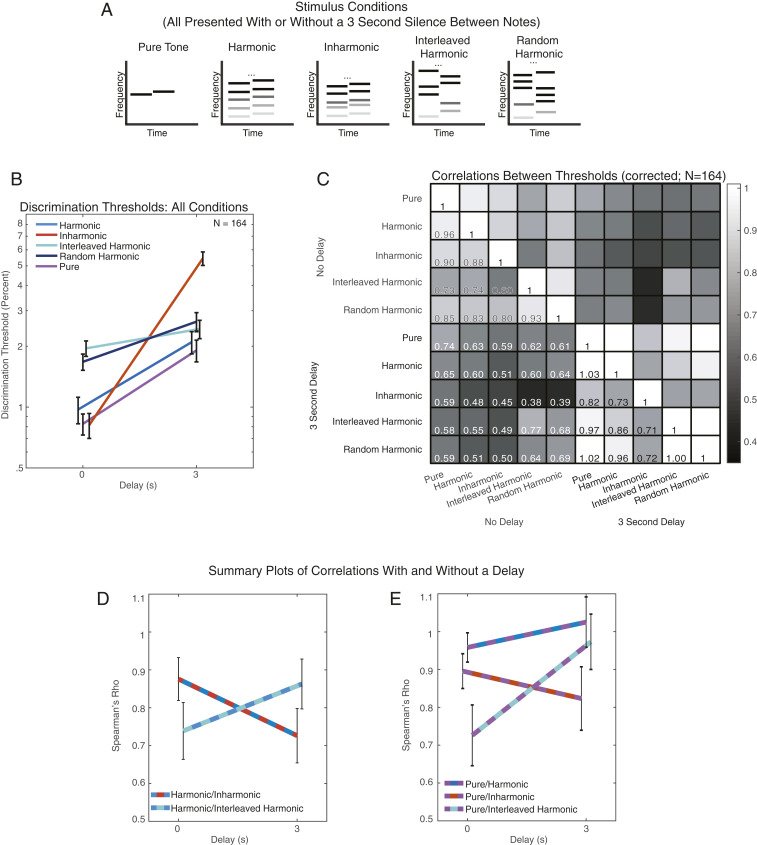
Fig. 6.
Experiment 6: Individual differences suggest different representations depending on memory demands. (A) Schematic of the five types of stimuli used in experiment 6. Task and procedure (adaptive threshold measurements) were identical to those of experiment 4, but with no intertrial delays. (B) Discrimination thresholds for all stimulus conditions, with and without a 3-s delay between tones. Here, and in D and E, error bars show SEM, calculated via bootstrap. (C) Matrix of the correlations between thresholds for all pairs of conditions. Correlations are Spearman’s ρ, corrected for the reliability of the threshold measurements (i.e., corrected for attenuation). Corrected correlations can slightly exceed 1 given that they are corrected with imperfect estimates of the reliabilities. (D) Comparison between Harmonic/Inharmonic and Harmonic/Interleaved Harmonic threshold correlations, with and without a delay. (E) Comparison between Pure Tone condition correlations with and without a delay.

