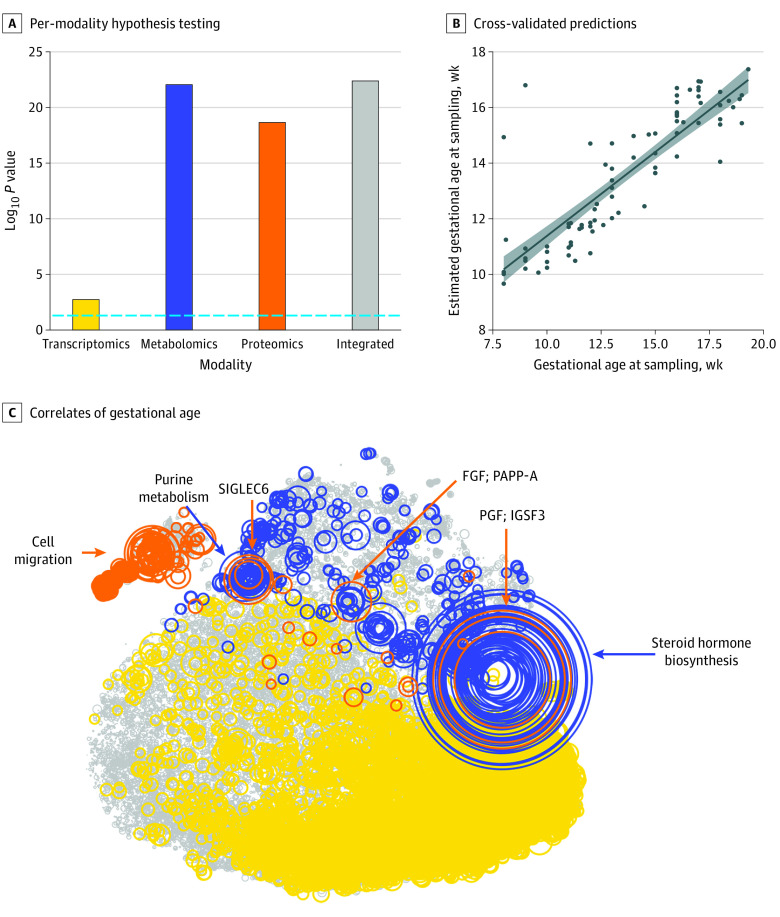
Figure 2. Prediction of Gestational Age (GA) at the Time of Sample Collection.
A, A cross-validation strategy was used to simultaneously optimize the integrated model and test the performance of the model on previously unseen patients. Models built on all 3 modalities (transcriptomics, metabolomics, and proteomics) and the integrated model were statistically significantly correlated with GA at the time of sample collection (Bonferroni-adjusted Spearman correlation P < .05). B, The correlation between GA at the time of sample collection and the estimated values on the blinded samples are shown. The shaded area represents the 95% CI. C, The features correlated with the progression of pregnancy (Spearman correlation P < .05) are color-coded according to biological modality. FGF indicates fibroblast growth factor; IGSF3, immunoglobulin superfamily member 3; PAPP-A, pregnancy-associated plasma protein A; PGF, placental growth factor; and SIGLEC6, sialic acid binding Ig-like lectin 6.

