
Figure 3. Predictive Modeling of Preterm Birth (PTB).
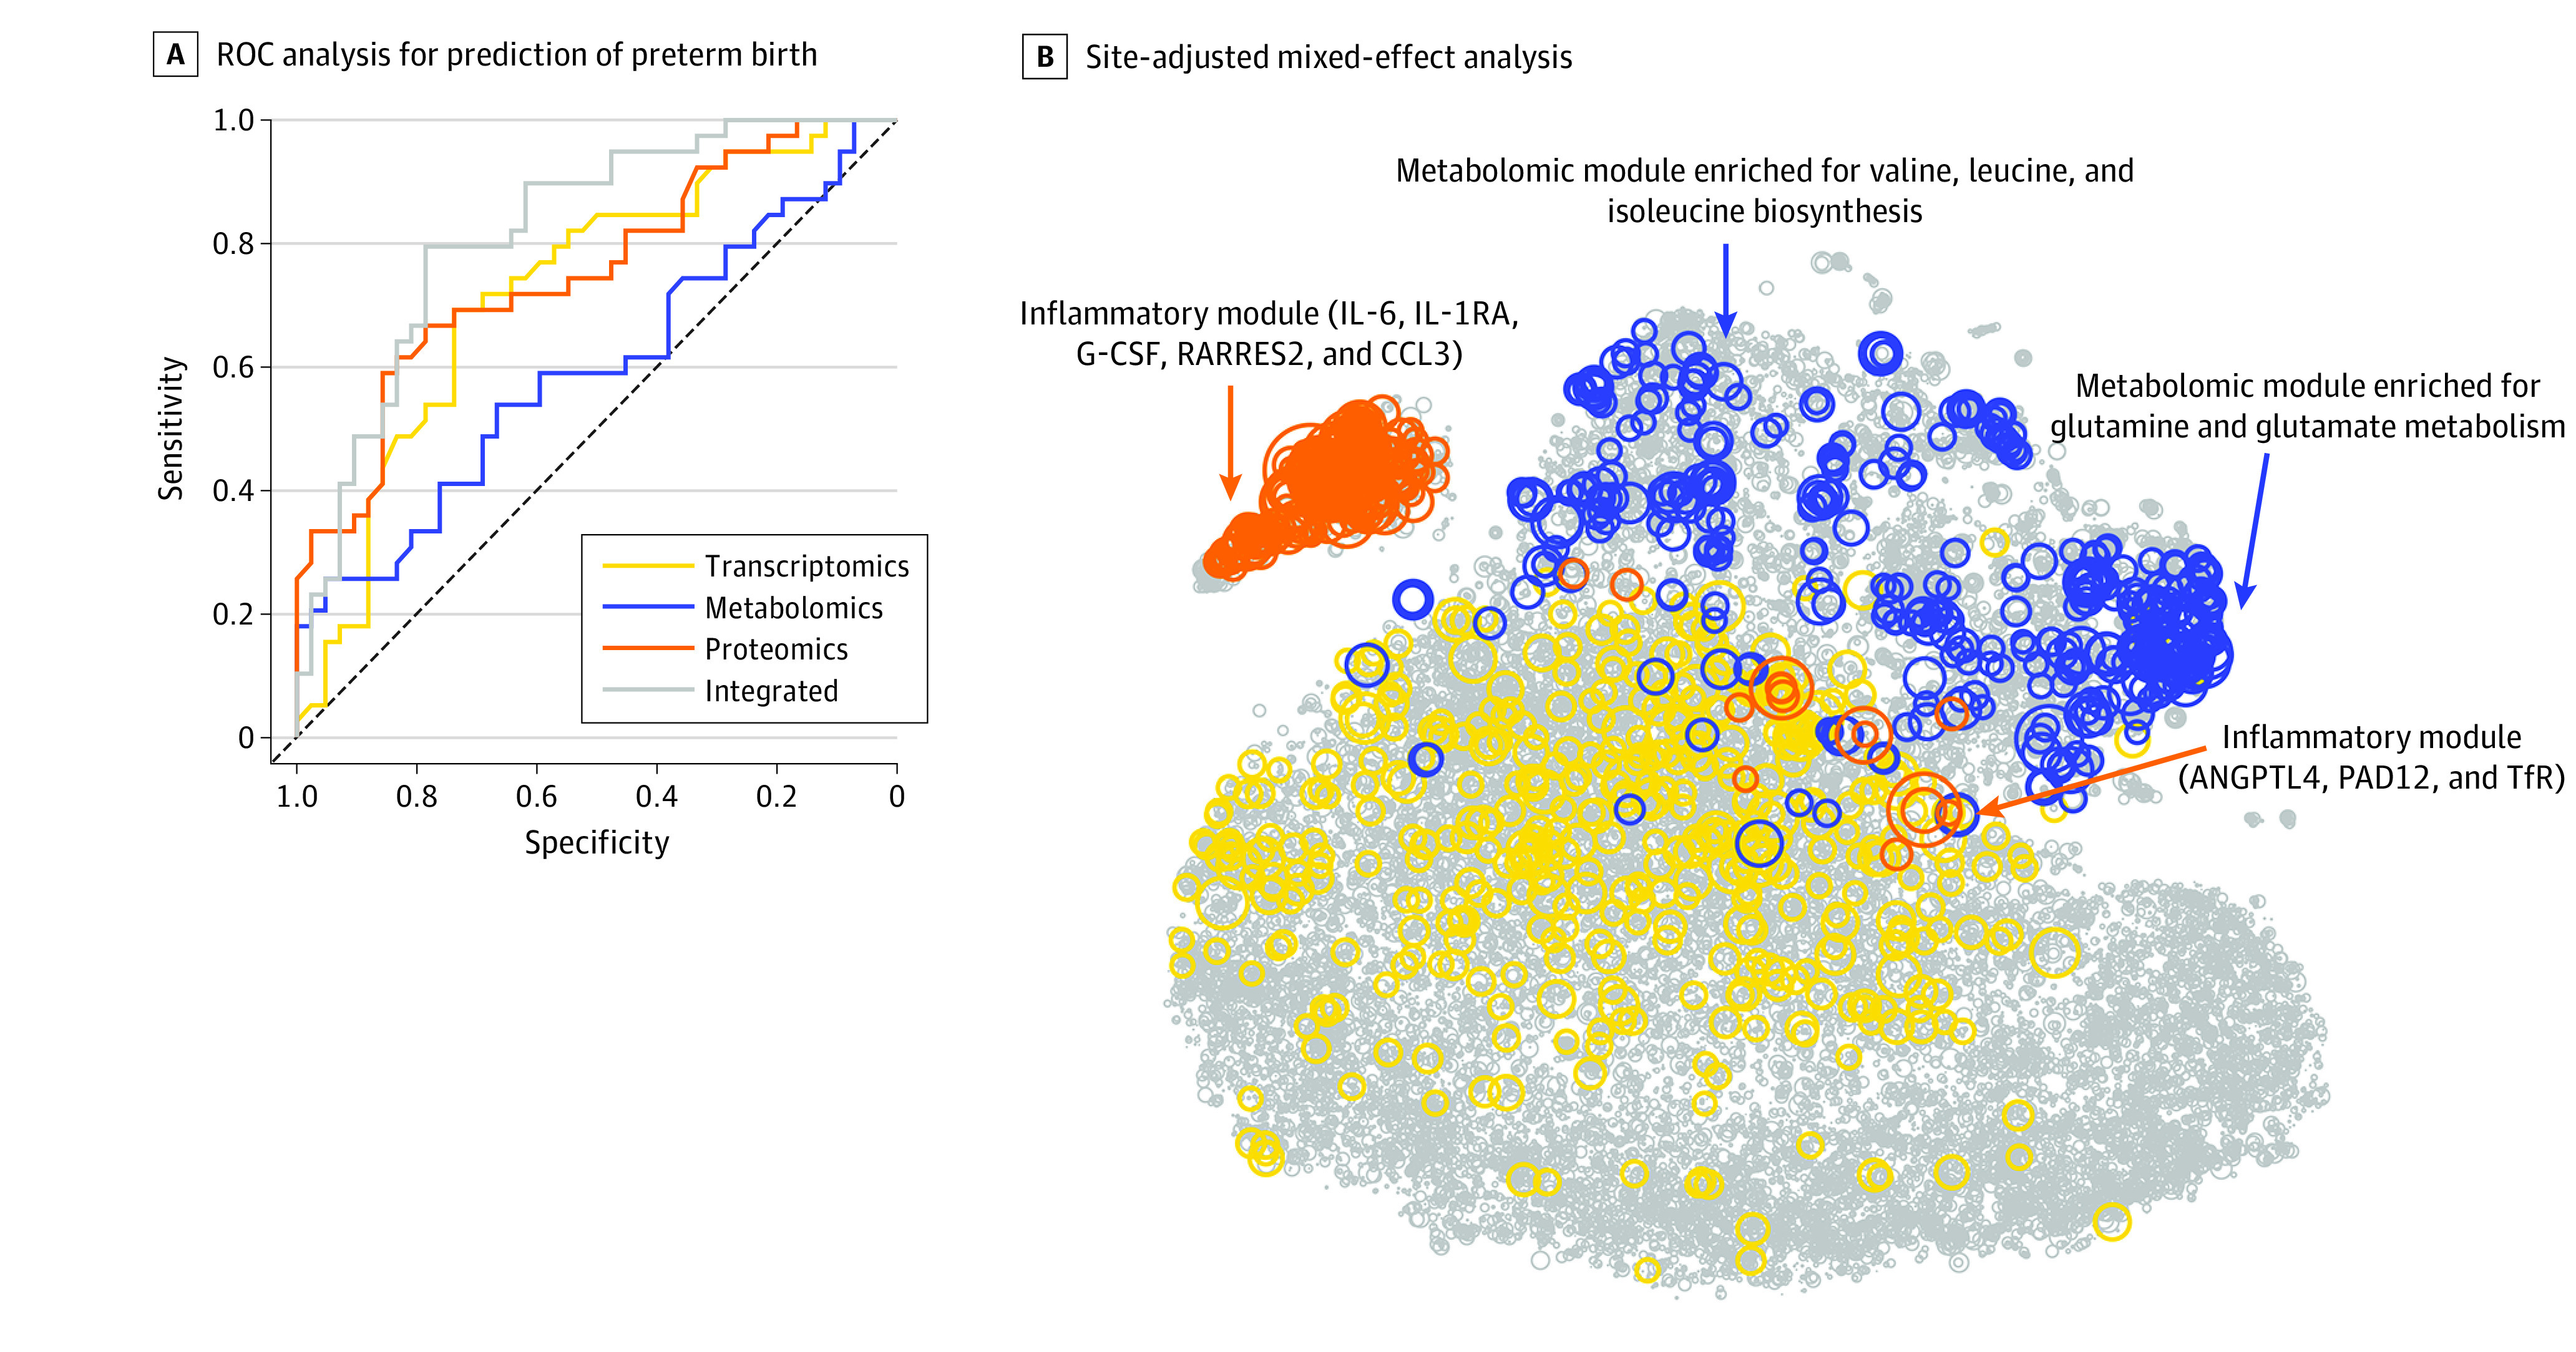
A, This receiver operating characteristic (ROC) curve analysis used each biological modality and the integrated approach. The mean area under the ROC curve and 95% CI for each modality were as follows: transcriptomics (AUROC, 0.73; 95% CI, 0.61-0.83), metabolomics (AUROC, 0.59; 95% CI, 0.47-0.72), proteomics (AUROC, 0.75; 95% CI, 0.64-0.85), and integrated (AUROC, 0.83; 95% CI, 0.72-0.91). B, Circle size is proportional to −log10 (Wilcoxon) P value for discrimination between term pregnancies and PTBs. Top features included an inflammatory module (which included interleukin 6 [IL-6]; IL-1 receptor antagonist [IL-1RA], a regulatory member of the IL-1 family whose expression is induced IL-1β under inflammatory conditions; granulocyte colony-stimulating factor [G-CSF]; retinoic acid receptor responder protein 2 [RARRES2]; chemokine ligand 3 [CCL3]; angiopoietin-like 4 [ANGPTL4]; protein-arginine deiminase type II [PADI2]; and transferrin receptor [TfR]) and a metabolomic module (which was enriched for glutamine and glutamate metabolism [Fisher test for pathway enrichment analysis P < 4.4 × 10⁻⁹] and valine, leucine, and isoleucine biosynthesis pathways [P < 7.3 × 10⁻⁶]).