
Figure 2.
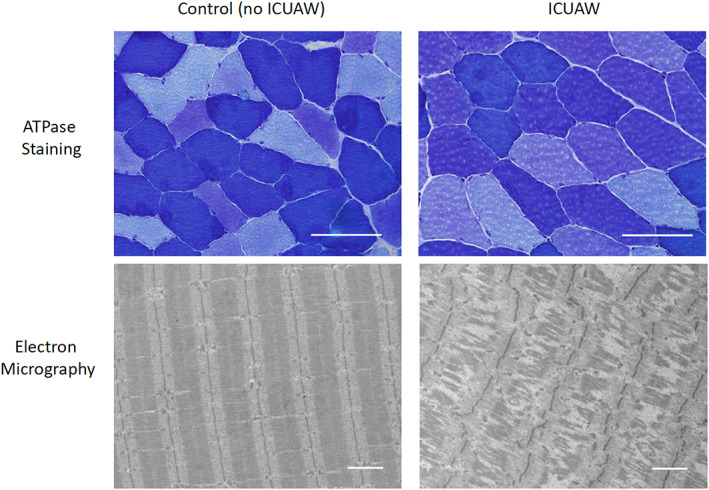
ATPase stained histologic sections and representative electron micrographs of critically ill patients with and without intensive care unit acquired weakness. Fiber types are differentiated by color (dark blue = I, intermediate blue = IIb, light blue = IIa). Scale bar indicates 100 μm (ATPase stained histologic sections) and 2 μm (electron micrographs).