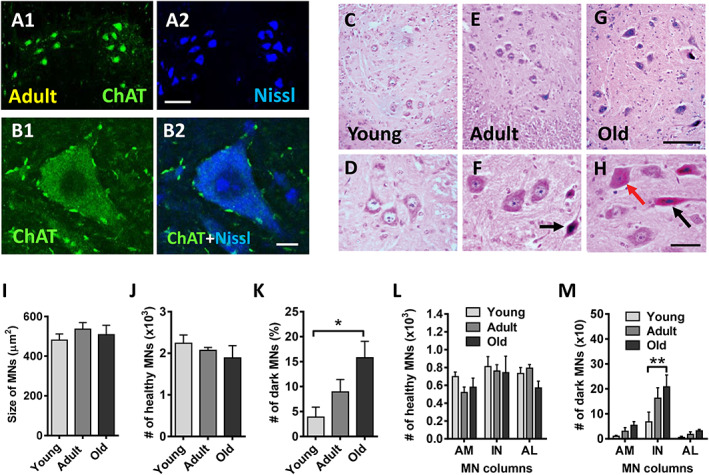
Figure 1.

No significant motoneuron (MN) loss occurs in the lumbar spinal cord of mice with ageing. (A1–B2) Representative images of MNs in the spinal cord of adult mice immunolabelled with an antibody anti‐choline acetyltransferase (ChAT) (green), as an MN marker, and counterstained with fluorescent Nissl for neuron visualization (blue) as indicated. (C–H) Representative images of haematoxylin and eosin‐stained MNs in the lumbar spinal cord of (C and D) young, (E and F) adult, and (G and H) old mice. The appearance of these MNs is shown at a higher magnification in (D, F, and H); black arrows in (F) and (H) indicate dark‐stained and shrunken MNs; the red arrow in (H) points to a non‐shrunken, hyperchromic, MN. (I) Average size (soma area in μm2) and (J) number of apparently healthy MNs and (K) proportion of dark MNs (expressed as the percentage of MNs), in the lumbar spinal cord of young, adult, and old mice. (L) Number of healthy and (M) dark MNs in anteromedial (AM), intermediate (IN), and anterolateral (AL) columns of ventral horn. The data in graphs are shown as mean ± SEM, * P < 0.05 and ** P < 0.01 (one‐way or two‐way ANOVA and Bonferroni's post hoc test); 4–5 mice per age. Scale bars: (A2) = 100 μm [valid for (A1)]; (B2) = 10 μm [valid for (B1)]; (G) = 100 μm [valid for (C) and (E)]; (H) = 40 μm [valid for (D) and (F)].
