Figure 5.

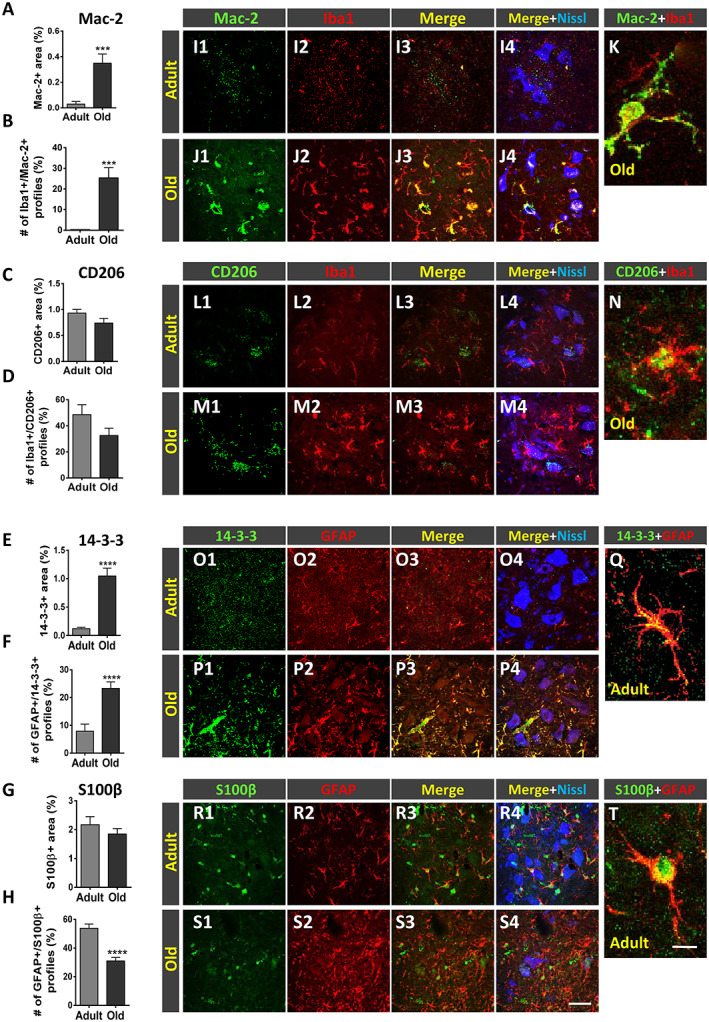
Age‐related changes in the phenotype of spinal cord microglia and astroglia. (A–J) Serial sections of lumbar spinal cord of adult and old mice were double immunostained for ionized calcium‐binding adaptor molecule 1 (Iba1) and either (M1) Mac‐2 or (M2) CD206 microglia, and glial fibrillary acidic protein (GFAP) and either (A1) 14‐3‐3 or (A2) S100β astroglia. Quantification of (A and C) Mac‐2‐positive and CD206‐positive profiles surrounding motoneurons (MNs), based on the ventral horn area occupied by these immunostained profiles; the proportion of microglial profiles expressing both Iba1 and either Mac‐2 or CD206 is shown in (B) and (D), respectively. Quantification of (E and G) 14‐3‐3‐positive and S100β‐positive profiles surrounding MNs based on the ventral horn area occupied by these immunostained profiles; the proportion of astroglial profiles expressing both GFAP and either 14‐3‐3 or S100β is shown in (F) and (H), respectively. Representative confocal micrographs used for data analysis showing (I1–K) Mac‐2, (L1–N) CD206, (O1–Q) 14‐3‐3, and (R1–T) S100β (all in green); microglial and astroglial markers were combined with Iba1 and GFAP, respectively (both in red), and fluorescent Nissl staining (blue) for MN visualization. Higher magnification images of Iba1‐positive microglial profiles also expressing either (K) Mac‐2 or (N) CD206 and GFAP‐positive astroglial profiles also expressing either (Q) 14‐3‐3 or (T) S100β in the ventral horn of adult spinal cords are shown. Data in the graphs are expressed as the mean ± SEM; the spinal cord of four animals per age group was used for analysis; a total of 40–45 sections per age were examined. *** P < 0.001 and **** P < 0.0001 vs. adult (Student's t‐test). Scale bars: In (S) = 50 μm [valid for (I1–J4), (L1–M4), (O1–P4), and (R1–S4)] and in (T) = 10 μm [valid for (K, N, and Q)].
