Figure 11.

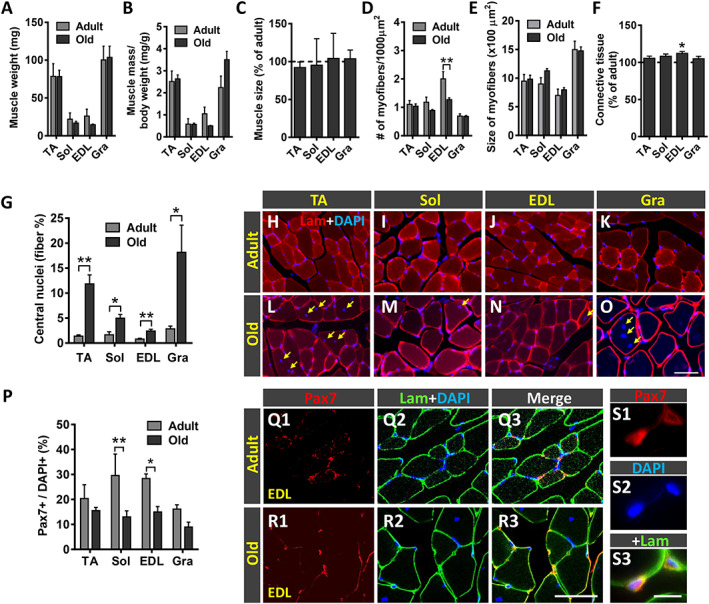
Effect of ageing on the histology of tibialis anterior (TA), soleus (Sol), extensor digitorum longus (EDL), and gracilis (Gra) muscles. (A) Wet weight of muscles (in mg) and (B) weight of muscles relative to body weight (expressed in mg/g). (C) Changes in the total cross‐sectional area of old muscles (expressed as the percentage with respect to adult muscles). (D) Density of fibres in muscles (expressed as the number of myofibers in 1000 μm2 muscle cross‐sectional area). (E) Average myofiber size (cross‐sectional area in μm2) of the muscles. (F) Changes in the content of connective tissue in old muscles (expressed as the percentage with respect to adult muscles). (G) Proportion of myofibers exhibiting central nuclei. (H–O) Representative images of transversal muscle sections, double labelled with an antibody against laminin (lam) and 4′,6‐diamidino‐2‐phenylindole dihydrochloride (DAPI) for DNA. (P) Percentage of paired box protein 7 (Pax7)‐immunostained cells (satellite cells) with respect to DAPI‐positive nuclei in adult and old muscles. Representative confocal images of Pax7 immunostaining (red) combined with immunolabelling for laminin (green) and DAPI staining (blue) in (Q1–Q3) adult and (R1–R3 and S1–S3) old EDL muscle sections. A higher magnification view of Pax7 immunostaining in old EDL muscle is shown in (S1–S3). Data in the graphs are expressed as the mean ± SEM, * P < 0.05, ** P < 0.01, and *** P < 0.001 vs. adult; n = 5–6 muscles for muscle type from different animals and age; number of fibres examined per muscle and mouse: (D and E) = 200, (G) = 3,000, and (P) = 100. Scale bar in (O) = 50 μm [valid for (H–N)]; (R3) = 40 μm [valid for (Q1–R2)]; and (S3) = 10 μm [valid for (R1–R2)].
