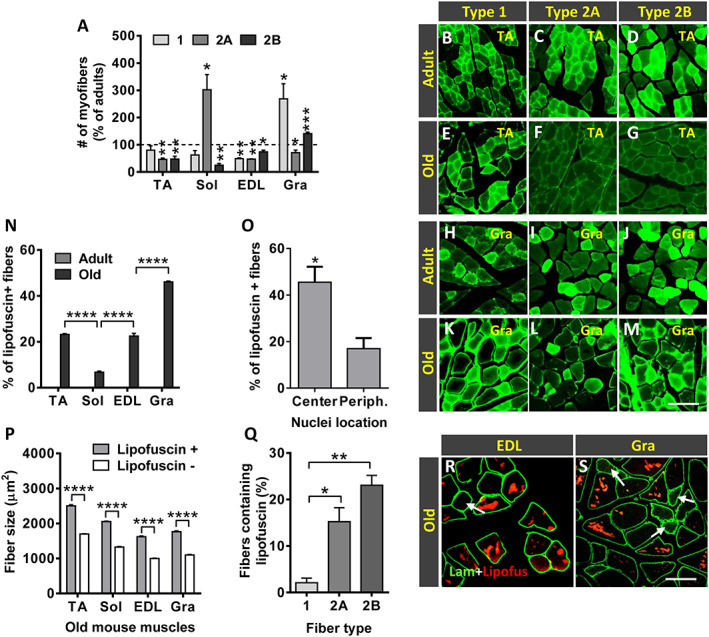
Figure 12.

Age‐related changes in fibre type composition and lipofuscin accumulation. (A) Changes in myofiber type composition in the old tibialis anterior (TA), soleus (Sol), extensor digitorum longus (EDL), and gracilis (Gra) muscles expressed as the proportion of types 1, 2A, and 2B fibres compared with respective adult muscles (* P < 0.05 and ** P < 0.01 vs. respective adult muscles; Student's t‐test). Representative images of (B–G) TA and (H–M) Gra muscles from (B–D and H–J) adult and (E–G and K–M) old mice, showing myosin heavy chain I, IIA, and IIB immunostaining to demonstrate types 1, 2A, and 2B myofibers, as indicated. (N) Percentage of fibres containing lipofuscin granules in muscles from adult and old mice. (O) Percentage of old TA muscle fibres with central or peripherally located nuclei containing lipofuscin aggregates. (P) Average size (cross‐sectional area in μm2) of myofibers with or without lipofuscin granules. (Q) Percentage of types 1, 2A, and 2B myofibers containing lipofuscin in the TA muscle of old mice. (R and S) Representative fluorescent images of EDL and Gra muscle sections processed for laminin immunostaining (green); lipofuscin autofluorescence was excited using 510–560 nm excitation and 590 nm emission filters; note that fibres with a small size are devoid of lipofuscin aggregates (arrows). Data in graphs are shown as the mean ± SEM of fibres analysed from four adult and five old muscles of different animals (number of examined myofibers per muscle: (N and O) = 400–700; (P and Q) = 300–500 (* P < 0.05, ** P < 0.01, *** P < 0.001, and **** P < 0.0001; one‐way or two‐way ANOVA and post hoc Bonferroni's test). Scale bars: (M) = 50 μm [valid for (B–L)] and (S) = 100 μm [valid for (R)].
