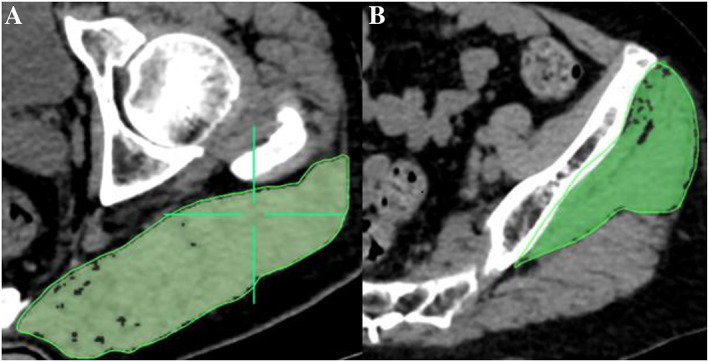
Figure 2.

(A) Measurement of cross‐sectional area and mean computed tomography values of the gluteus maximus muscle at the level of the greater trochanter of the femur. (B) Measurement of the gluteus medius and minimus muscle at the third sacral level. Muscle region is represented by the area highlighted in green.
