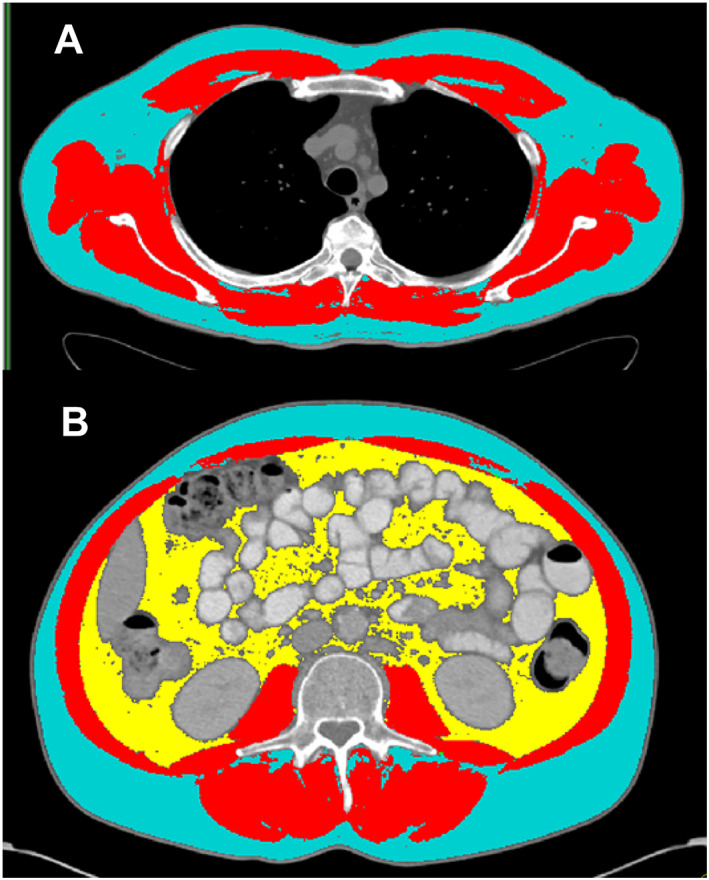
Figure 1.

Example thoracic (T4) and lumbar (L3) computed tomography scans with tissue quantification. At the thoracic level (A), skeletal muscle is displayed in red, and subcutaneous adipose tissue is displayed in blue. At the lumbar level (B), skeletal muscle is displayed in red, subcutaneous adipose tissue in blue, and visceral adipose tissue in yellow.
