
Figure 2.
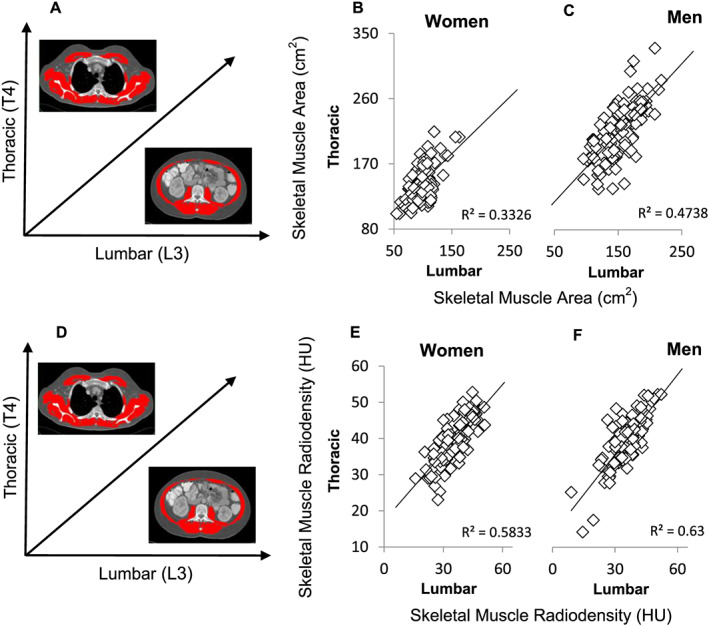
T4 vs. L3 correlations for muscle characteristics (skeletal muscle area/skeletal muscle radiodensity). Panel (A) illustrates the vertebral landmark and tissue on the axes of panels (B) and (C); panel (D) does the same for (E) and (F). Correlations were assessed between skeletal muscle area and skeletal muscle radiodensity at two vertebral levels and are presented for male (n = 116; panels C/F, respectively) and female (n = 99; panels B/E, respectively) patients. HU, Hounsfield unit.